Reactive Interaction Gateway

Reactive Interaction Gateway

  • User Documentation
  • Source Documentation
  • GitHub

›RIG in Production

Getting Started

  • Intro
  • Tutorial
  • Examples
  • FAQ

Main Concepts

  • Architecture
  • Features
  • Event Format
  • Publishing Events
  • Receiving Events
  • Forwarding Requests
  • User Authorization
  • Distributed Tracing

Advanced Guides

  • API Gateway Management
  • API Gateway Synchronization
  • Avro
  • JWT Blacklisting
  • Azure Event Hubs

RIG in Production

  • Operator's Guide
  • API Documentation
  • Phoenix LiveDashboard
  • Prometheus Metrics
  • HTTPS
  • Scaling

Hacking the Source

  • Developer's Guide

Phoenix LiveDashboard

Introduction

Phoenix LiveDashboard provides real-time performance monitoring and debugging tools.
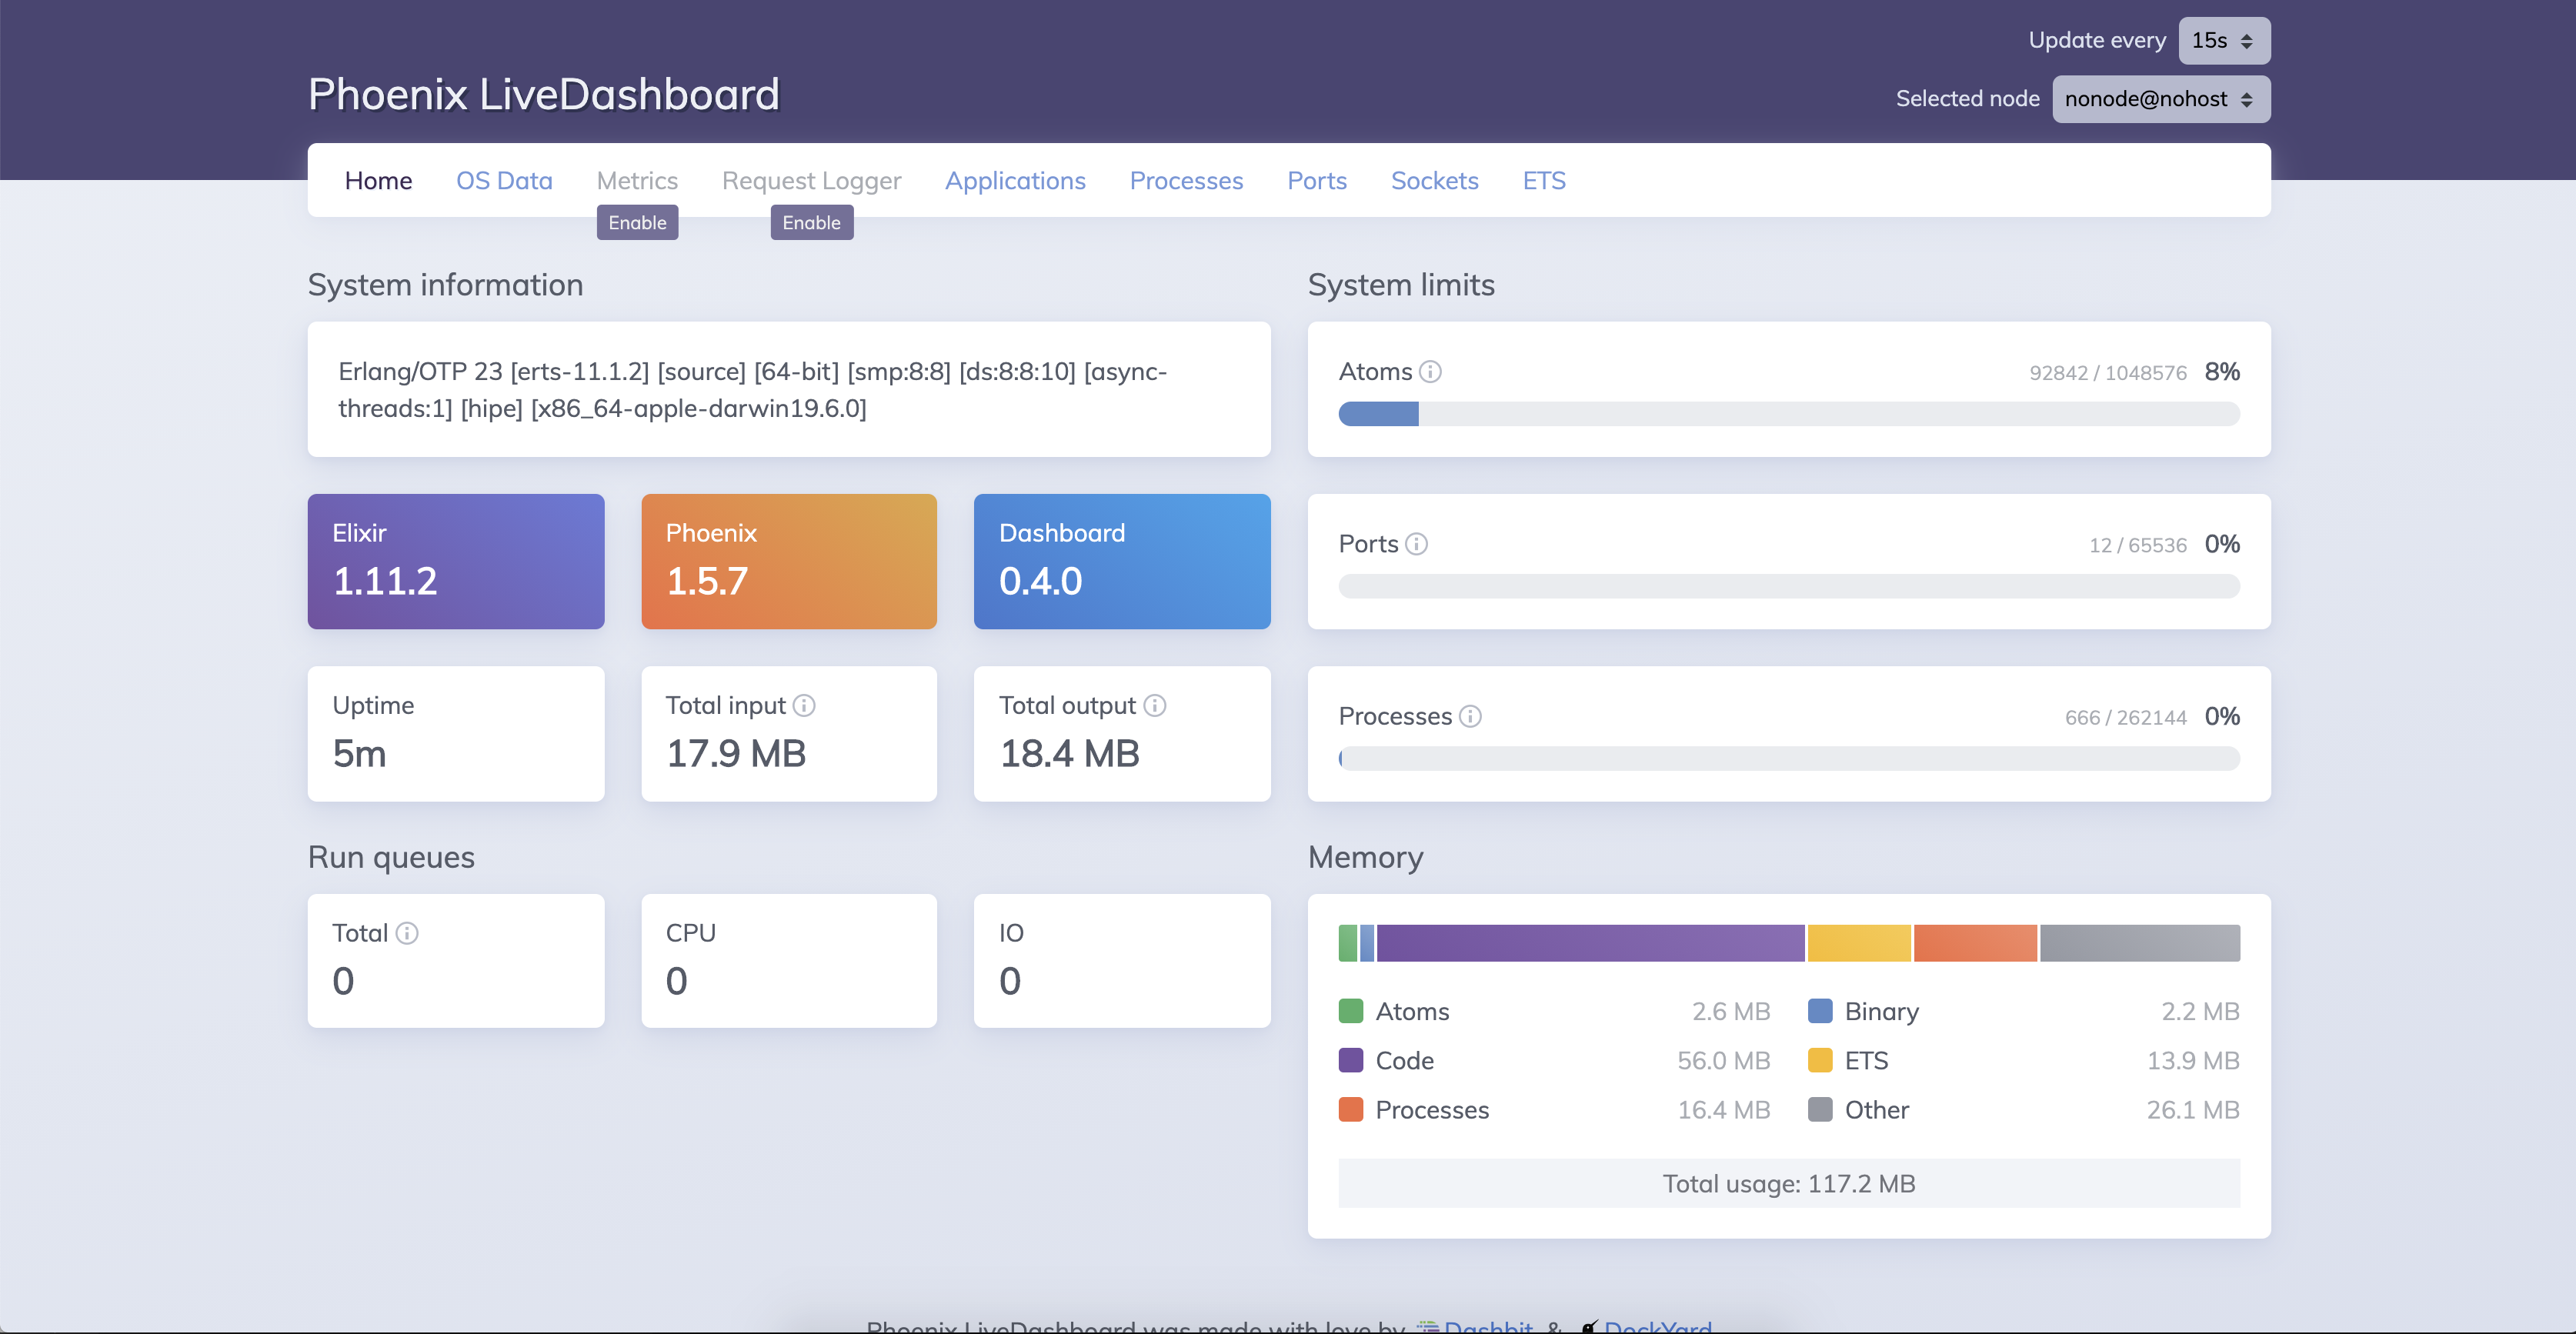
phoenix-live-dashboard

It's accessible at :4010/dashboard. All metrics are created via the same Prometheus metrics as those in the Grafana dashboards.

Phoenix LiveDashboard vs. Grafana

Phoenix LiveDashboard is a much simpler and quicker overview over the RIG (or any Elixir app). It provides metrics in real-time fashion, but only from the point when you open a given metric (it doesn't use any database). In addition it offers some Erlang/Elixir specific statistics/information which you won't find in the Grafana dashboards.

← API DocumentationPrometheus Metrics →
  • Introduction
  • Phoenix LiveDashboard vs. Grafana
Docs
IntroGetting Started
Community
User ShowcaseSlackStack Overflow@KevnBadr
More
Star RIG on GitHub
Copyright © 2021 Accenture