Prometheus Metrics
Introduction
RIG is providing its metrics in Prometheus format. Prometheus is CNCFs second graduated project and therefore can be assumed as de-facto standard.
These metrics can be used to be included into a monitoring platform like Grafana.
RIG exposes Metrics in Prometheus format on its API endpoint under /metrics. Metrics can be enabled/disabled via PROMETHEUS_METRICS_ENABLED env var (by default enabled).
RIG Specific Metrics
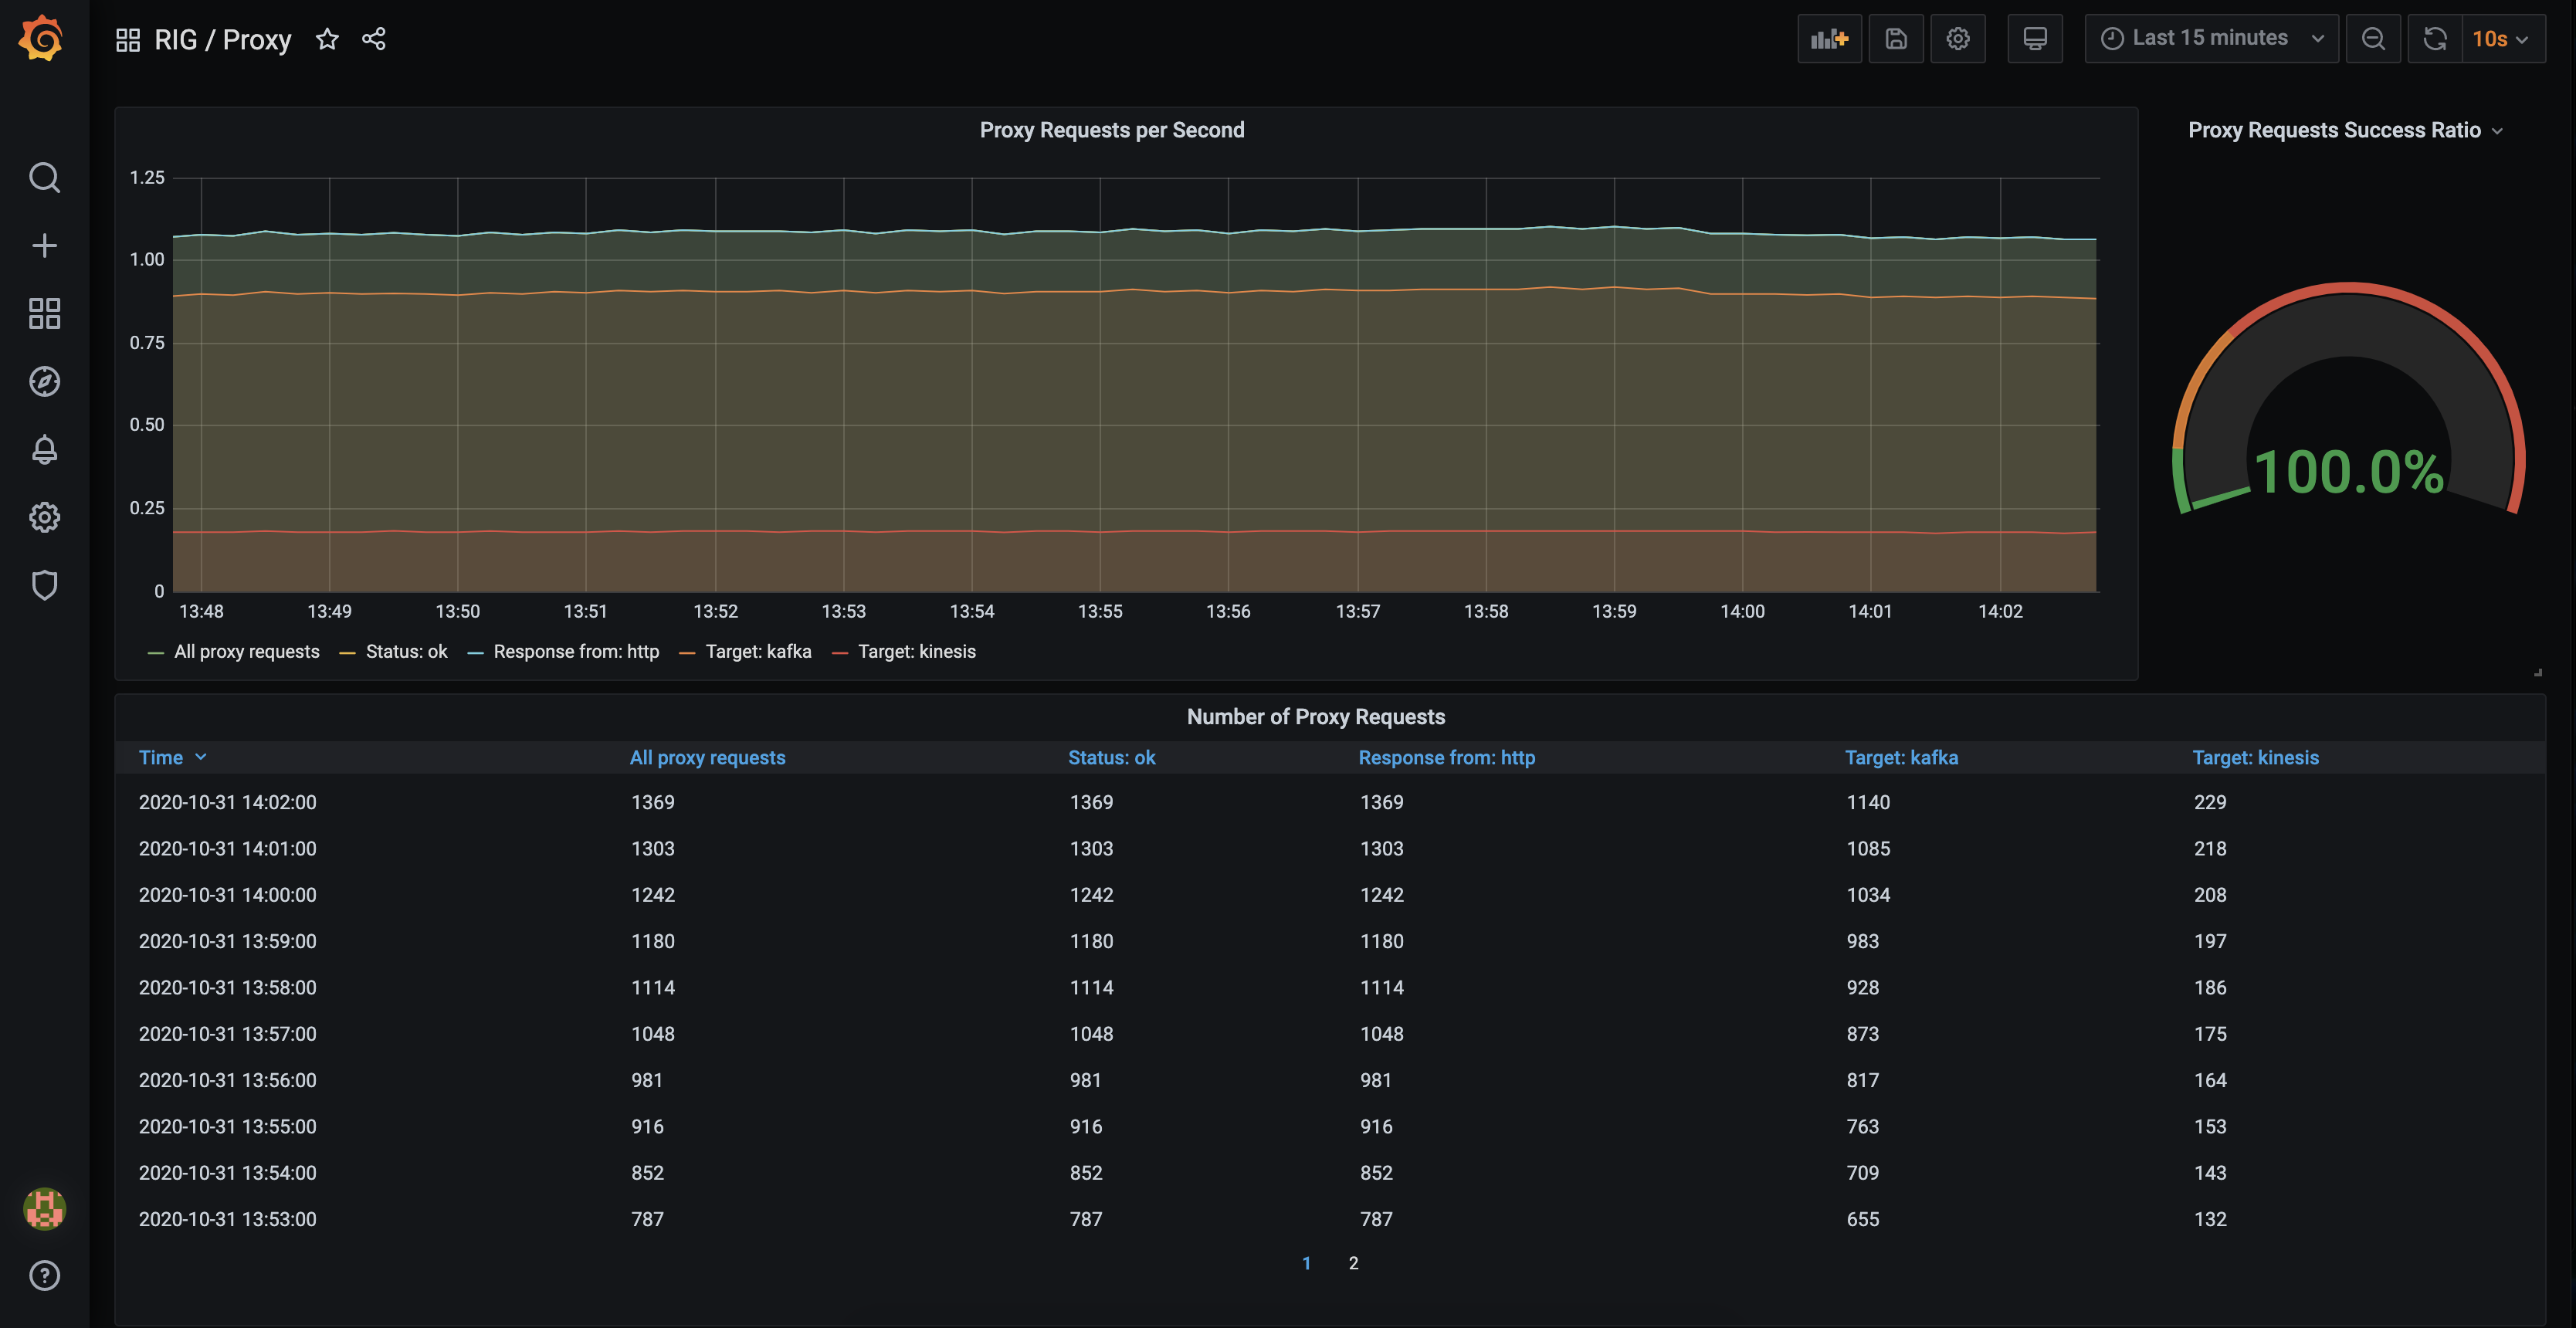
Proxy Metrics
rig_proxy_requests_total
With this metric the usage of RIGs API Proxy/Gateway can be monitored.
Following Labels are provided:
- method - The HTTP method called for this request Following possible values:
GETPOSTPUTPATCHDELETEHEADOPTIONS
- path_regex - The path used for this request.
- target - The target for this request. Grabbed from proxy config. Following possible values:
httpkafkakinesisN/A- Not applicable, e.g., the request path is not configured.
- response_from - Where the response is provided from. Grabbed from proxy config. Following possible values:
httpkafkahttp_asyncN/A- Not applicable, e.g., the request path is not configured.
- status - The internal status for the request. Attention: this status only tracks the internal rig process status. Once forwarded we track as "ok". We expect that called services are monitored on it's own. Following possible status codes:
ok- Forwarded successfully.bad_request- Missing body parameters (kafkaandkinesisonly).not_found- No configuration found for the givenmethodand/orpath.unreachable- The backend cannot be connected to (e.g., service is offline or domain cannot be resolved)request_timeout- The service is reachable but fails to deliver a response in time.response_timeout- The endpoint has itsresponse_fromparameter set and RIG times out while waiting for a response.
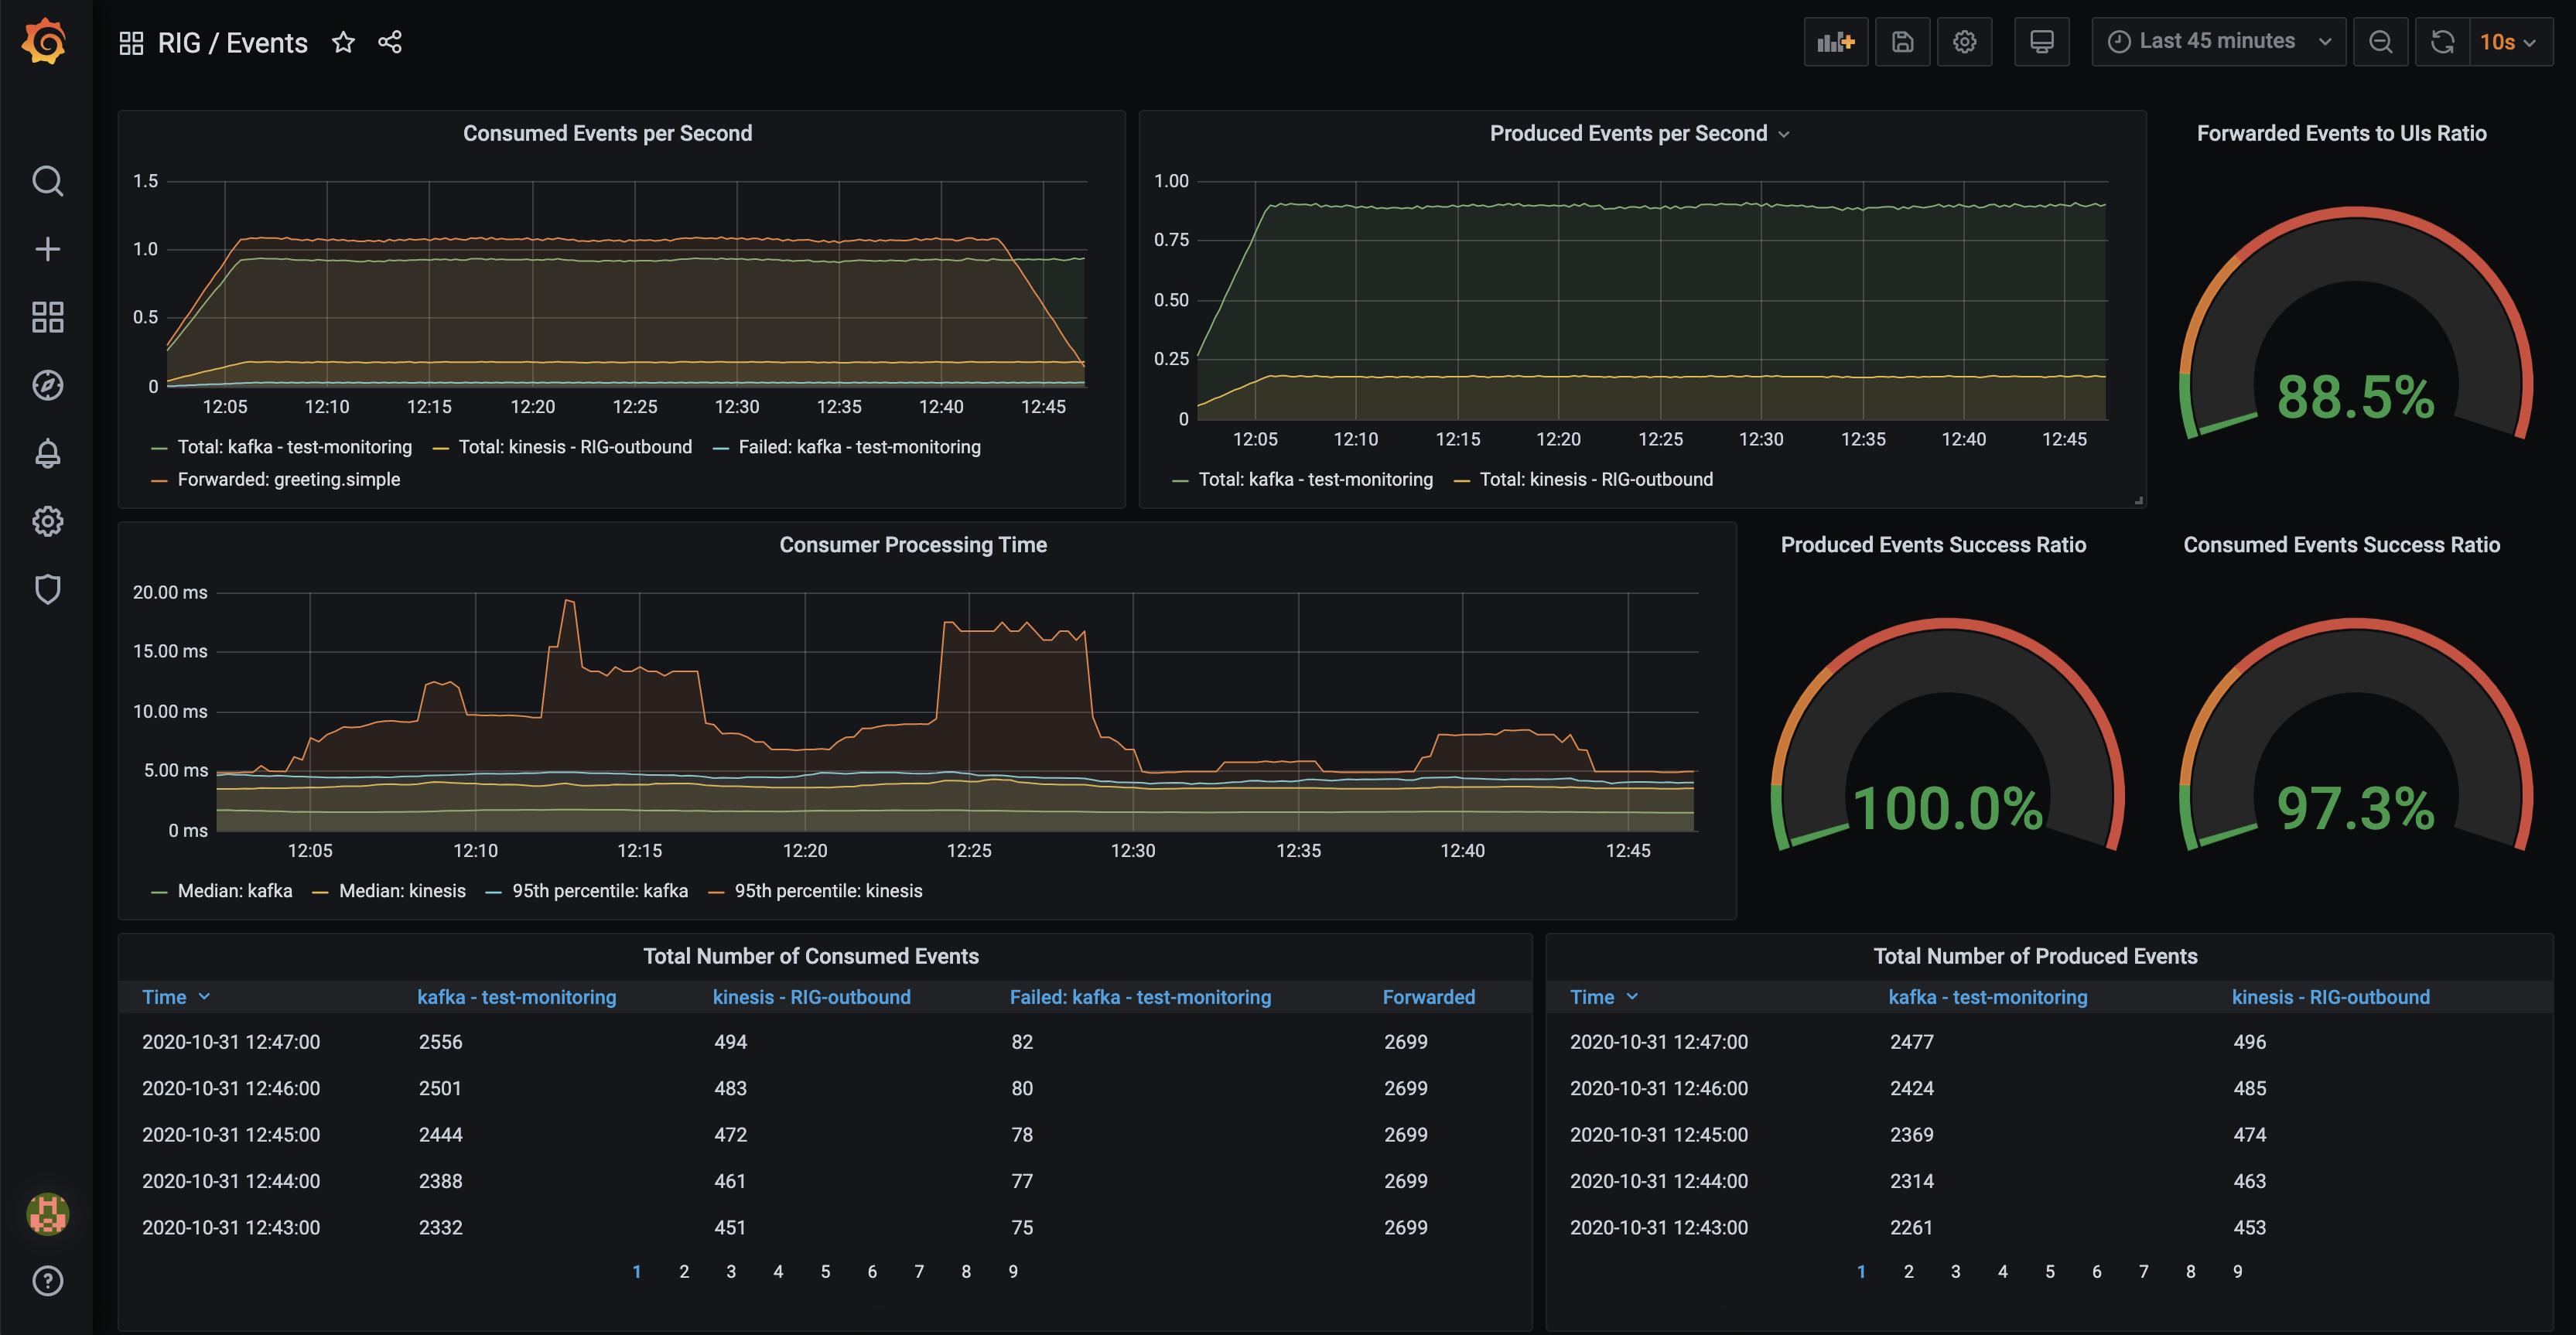
Events
rig_consumed_events_forwarded_total
Counts all events forwarded to a frontend.
Following Labels are provided:
- type - event type
rig_consumed_events_total
Counts all consumed events.
Following Labels are provided:
- topic
- source
kafkakinesis
rig_consumed_events_failed_total
Counts all events that failed when handling an event.
- topic
- source
kafkakinesis
rig_consumed_event_processing_duration_milliseconds
Histogram measuring how long it took to process the event (serialization, filtering & forwarding to a frontend).
- topic
- source
kafkakinesis
rig_produced_events_total
Counts all successfully produced events.
- topic
- target
kafkakinesis
rig_produced_events_failed_total
Counts all events that failed to be produced.
- topic
- target
kafkakinesis
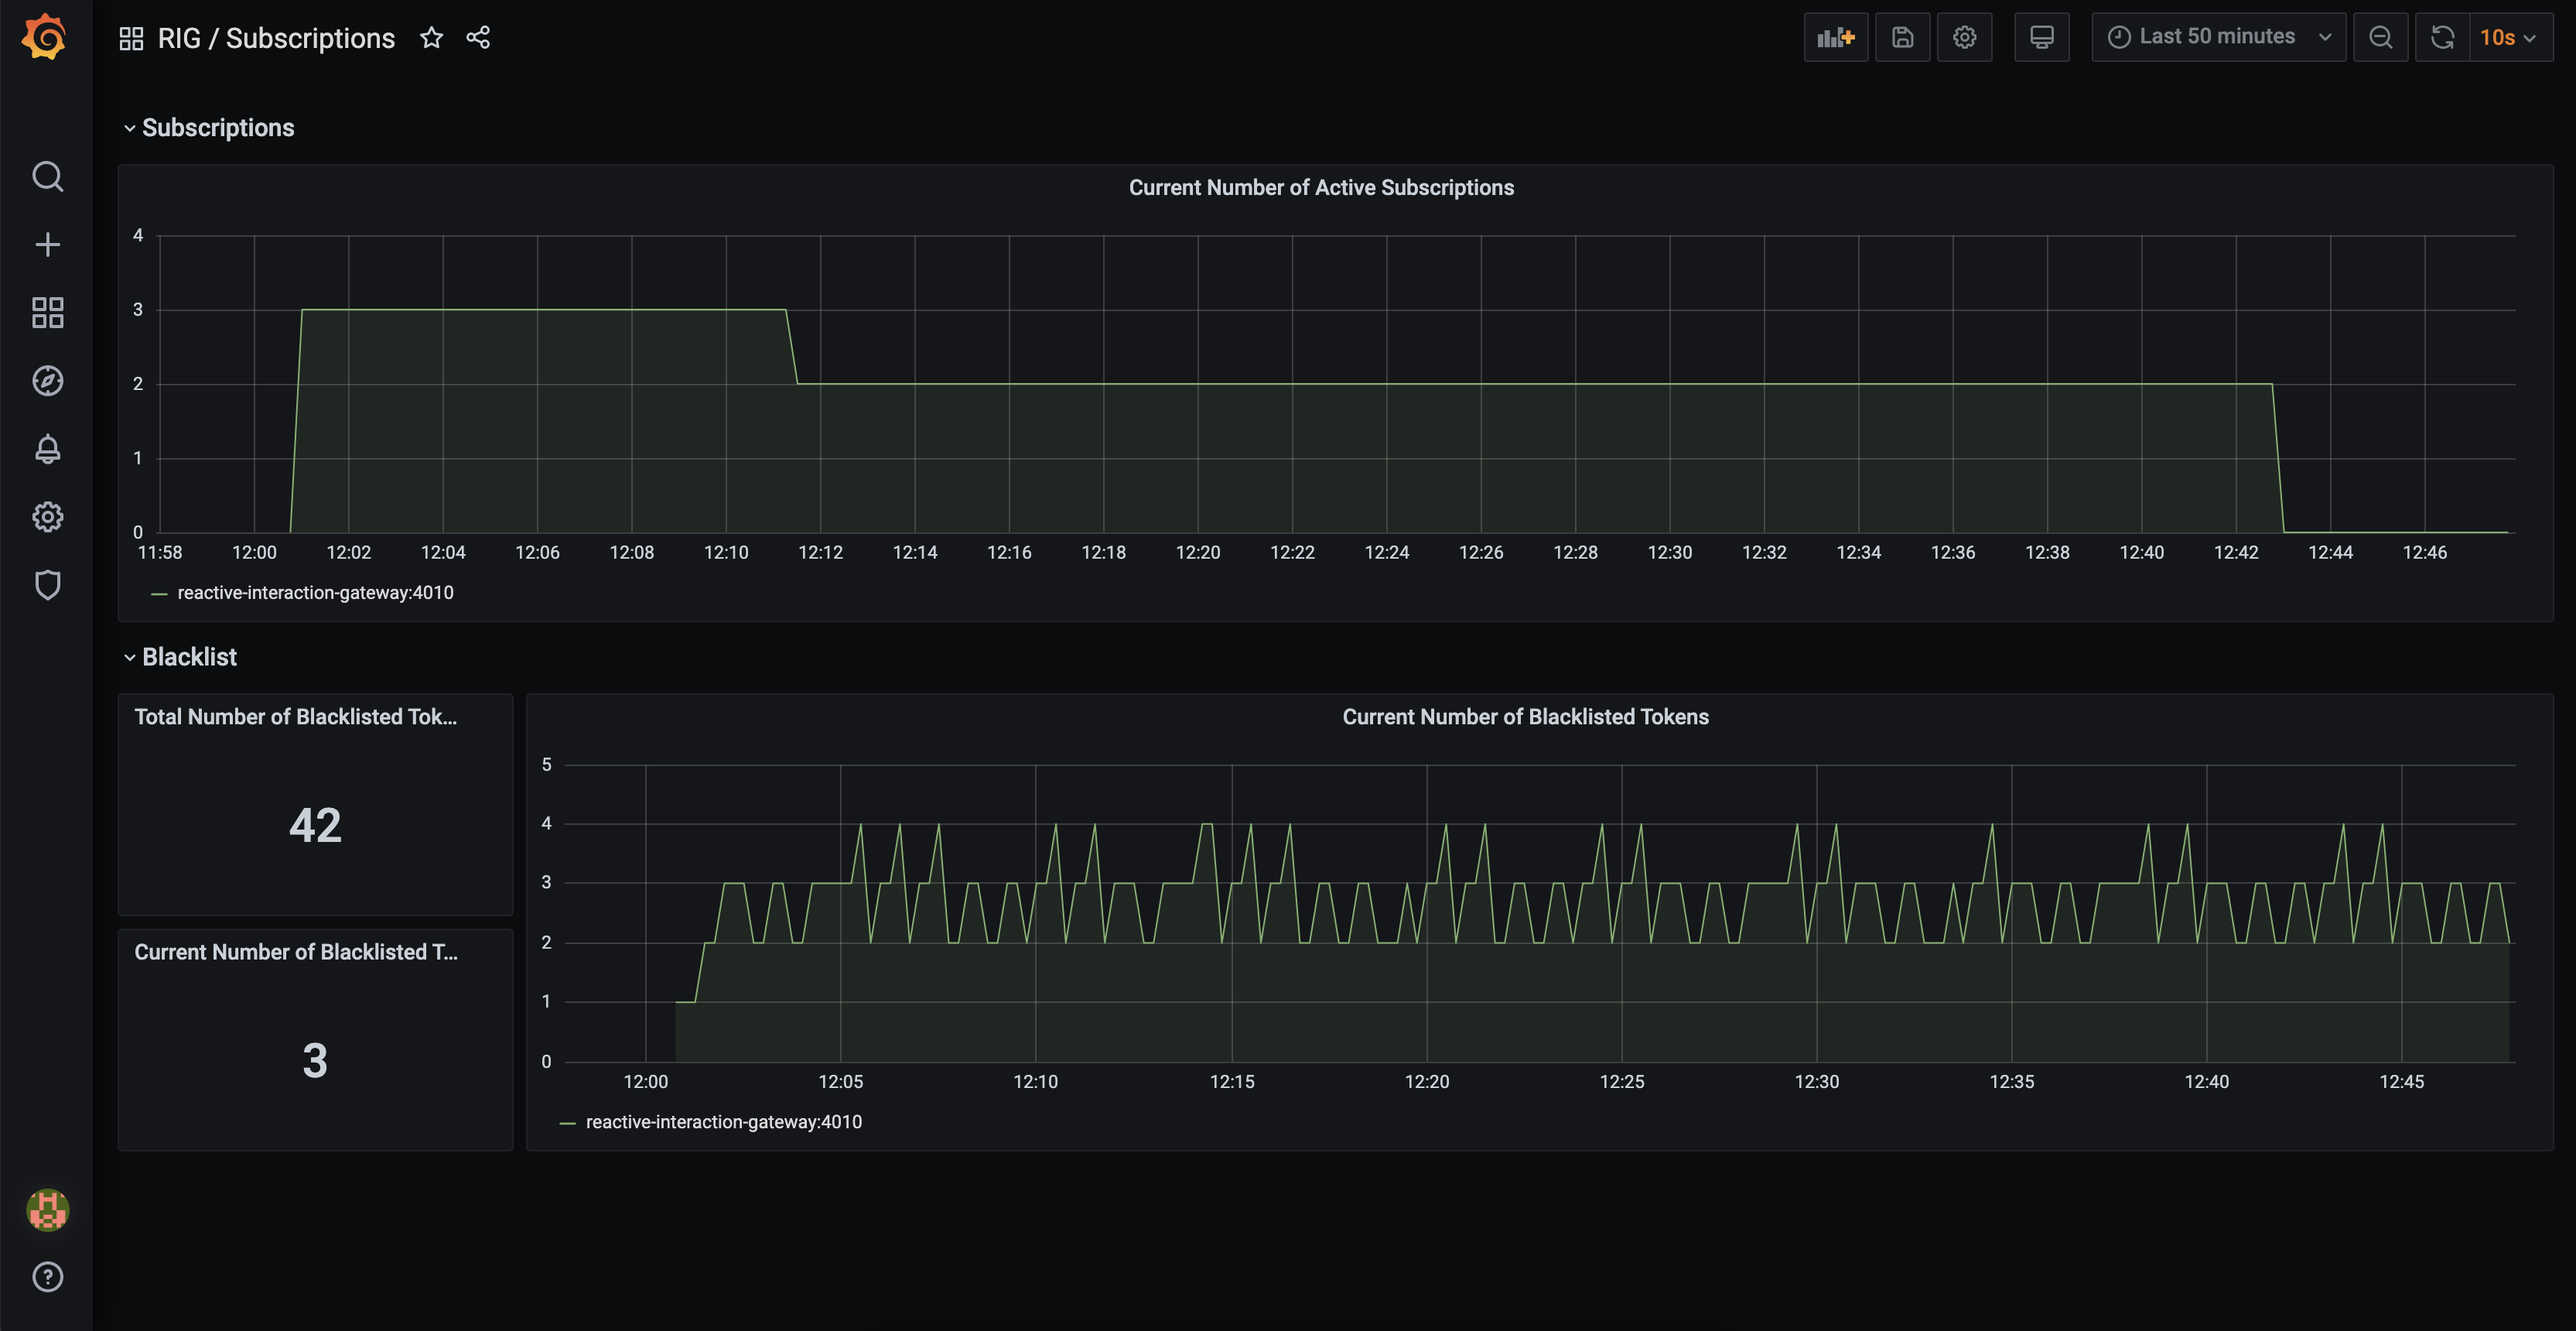
Subscriptions
rig_subscriptions_total
Counts current number of event subscriptions.
Blacklist
rig_distributed_set_items_total{name="Elixir.SessionBlacklist"}
Counts all JWTs that are blacklisted.
rig_distributed_set_items_current{name="Elixir.SessionBlacklist"}
Counts current number of blacklisted JWTs.
rig_distributed_set_items_*is generic metric for all distributed sets, so you can create visualizations also for them.
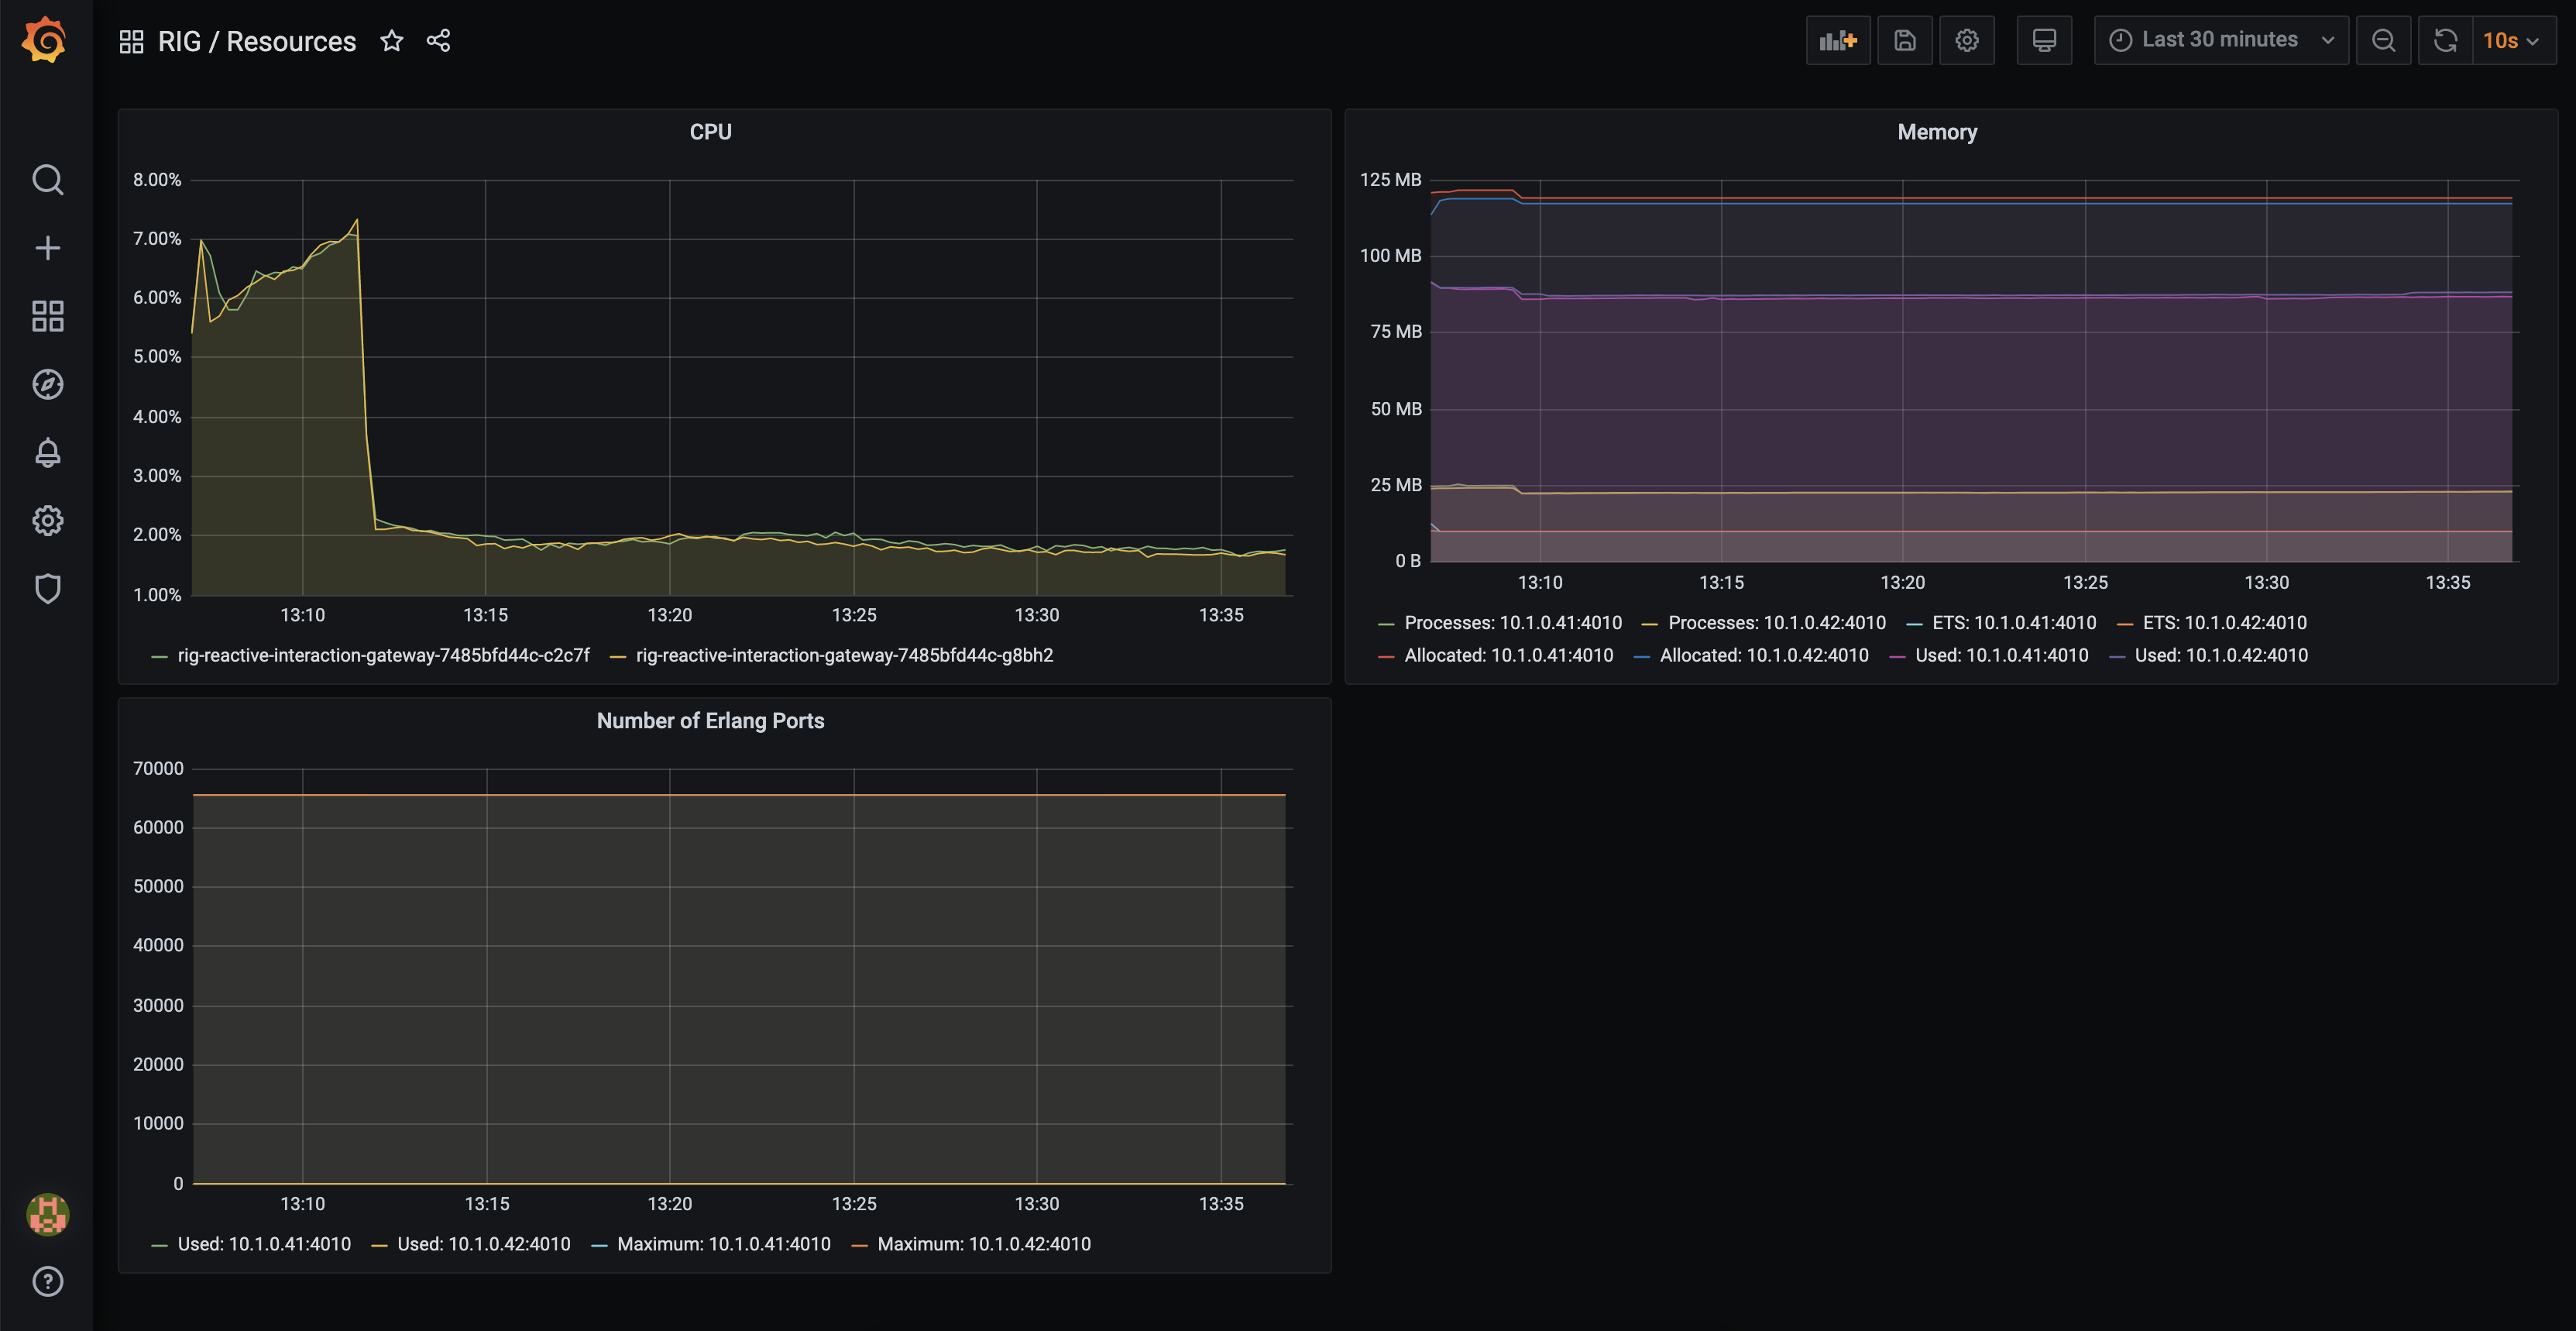
Standard Metrics
We are exposing the standard metrics providing information about the running application itself.
Following standard metrics are currently provided:
- erlang_vm_memory_ets_tables - Erlang VM ETS Tables count
- erlang_vm_memory_atom_bytes_total (Labels: Free, Used) - The total amount of memory currently allocated for atoms. This memory is part of the memory presented as system memory.
- erlang_vm_port_limit - The maximum number of simultaneously existing ports at the local node
- etc.
Detailed documentation to these standard metrics can be found here.
Usecase
To use RIG-Metrics for monitoring in Grafana, following steps are required:
- Add the RIG-Metrics endpoint to the Prometheus config-file
prometheus.yml+ start the Prometheus server- In your RIG-Logs you should see continuous calls to the
/metrics-Endpoint (Prometheus is implemented that it will actively gather data from the configured endpoints)
- In your RIG-Logs you should see continuous calls to the
- In the Grafana frontend add Prometheus as a new datasource
- Now RIG-Metrics can be used to create dashboards
Note: This usecase was only described on a very high level to get an idea on how to use metrics. We highly recommend to check out the Prometheus and Grafana Tutorials if you plan to set this up
Grafana Dashboards
Example Grafana dashboards for the standard metrics can be found here.
Custom Dashboards
We also provide our own Grafana dashboards with RIG specific metrics. You can find it in the dashboards folder.
The metrics folder includes example setup using docker-compose.
Events
Proxy
Resources
Subscriptions
Kudus to deadtrickster for his awesome prometheus integration package.