

Export BI
Export BI generates a star-schema data bundle from the latest assessment results and makes it ready to load into Power BI, Tableau, or any other BI tool that can read CSV or JSON. For Power BI users, SWAO ships pre-built .pbit dashboard templates that connect to this bundle out of the box.
Access from the TUI main menu by pressing 6, or from the command line:
swao export --app <app-id>For a portfolio-level export that aggregates all applications:
swao export --portfolioDashboard preview
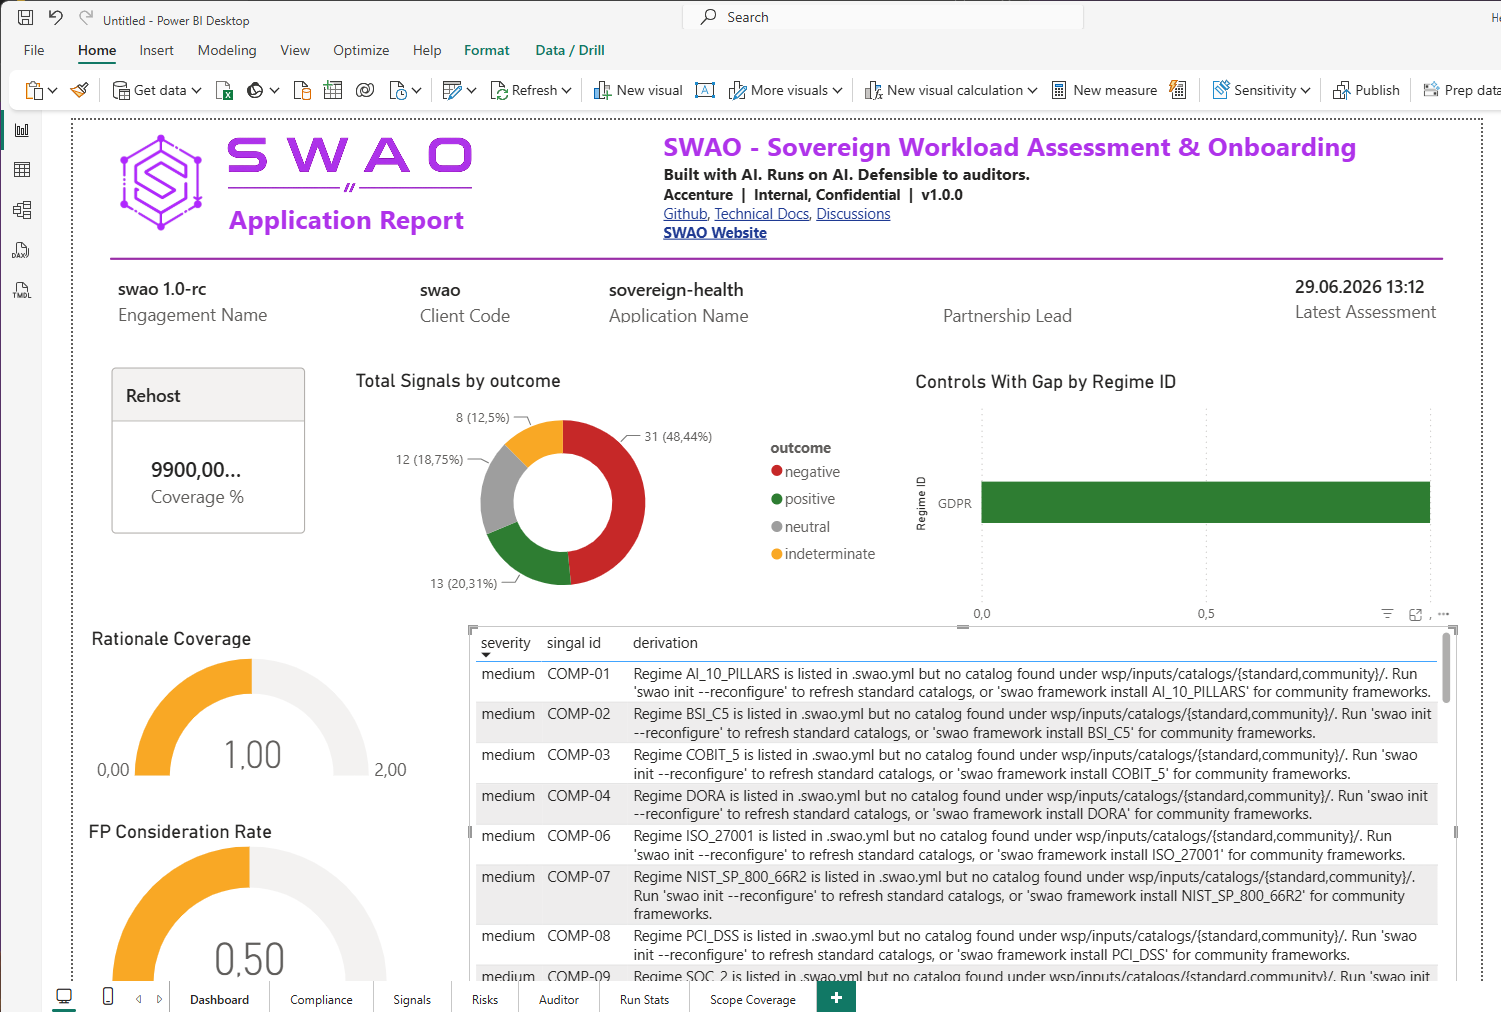
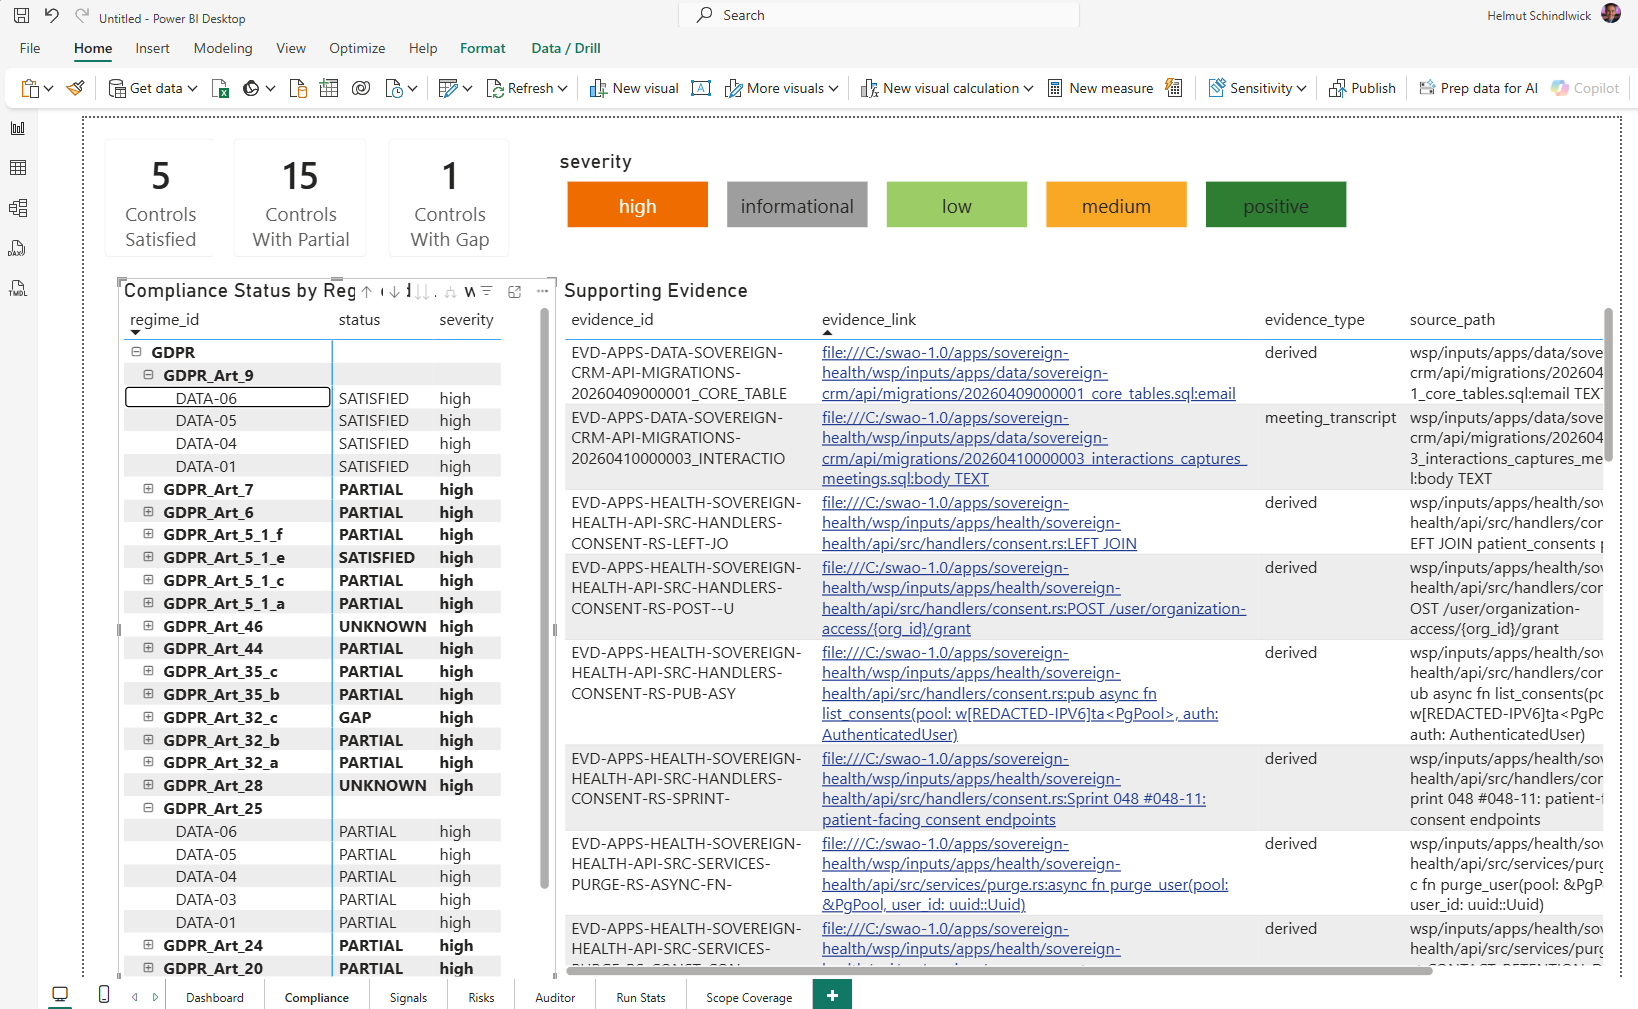
The single-application Power BI dashboard gives you an instant visual read of the assessment: verdict, coverage score, compliance matrix, risk register, and full signal detail -- all filterable and drillable.
What the export bundle contains
Every export produces a consistent set of files in apps/<id>/wsp/exports/latest/:
| File | Contents |
|---|---|
dim_app.csv | Application metadata: name, stack, 7R verdict, coverage score |
dim_control.csv | Framework controls with ID, domain, and description |
dim_evidence.csv | Evidence items with source path and type |
dim_signal.csv | All signals with ID, severity, control mapping, and rationale |
fact_pass_runs.csv | Per-pass run statistics: wall time, signal count, LLM token usage, cost |
fact_signals.csv | Signal-level compliance verdict (SATISFIED / GAP / PARTIAL) |
link_signal_evidence.csv | Many-to-many join between signals and evidence items |
link_control_evidence.csv | Many-to-many join between controls and evidence |
| ... + 9 further dimension and fact tables | Full star schema for advanced reporting |
An NDJSON mirror of every table is generated alongside the CSV files for use with tools that prefer JSON input. An XLSX rollup sheet is also included for quick review in Excel without loading the full Power BI template.
Power BI templates
SWAO ships two pre-built Power BI templates (.pbit files) that connect to the export bundle automatically once you set the workspace path parameter.
Single-application dashboard
Six report pages covering one application:
| Page | What it shows |
|---|---|
| Dashboard | 7R verdict, coverage score, signal-outcome donut, regime gap bar chart |
| Compliance | Controls-by-regime matrix with SATISFIED / GAP / PARTIAL colour coding |
| Signals | Full signal list with severity filter, rationale text, and evidence links |
| Risks | Risk register table, risk-score bar chart, category donut |
| Auditor | Signal-level false-positive analysis, rationale coverage metrics, block-level assessments |
| Run Stats | Pass timing, LLM cost, and token breakdown per run |
Portfolio dashboard
Five report pages covering all applications in the workspace (Enterprise):
| Page | What it shows |
|---|---|
| Portfolio Overview | App count, critical risk count, average coverage, 7R distribution donut, risk-ranked table |
| Compliance | Cross-app compliance matrix showing every control by framework and application |
| Signals | Portfolio-level signal browser |
| Auditor Roll-up | Aggregate rationale coverage, FP consideration rate, cross-app compliance status |
| Run Stats | Portfolio-level timing and cost summary |
Supported editions
| Feature | Community | Consultant | Enterprise |
|---|---|---|---|
| Star schema CSV / NDJSON export | Yes | Yes | Yes |
| Power BI single-app dashboard | -- | Yes | Yes |
| Power BI portfolio dashboard | -- | -- | Yes |
Template guides
For detailed instructions on connecting the .pbit templates to your export bundle, parameterising queries, and refreshing data, see the template documentation: