

SWAO Sample Gallery
Screenshots from real assessment runs, covering the CLI, Power BI reports, the terminal interface, and the Claude Desktop MCP connector. All captures are from SWAO v0.4.8 against live workspaces.
CLI
swao init -- workspace scaffolding
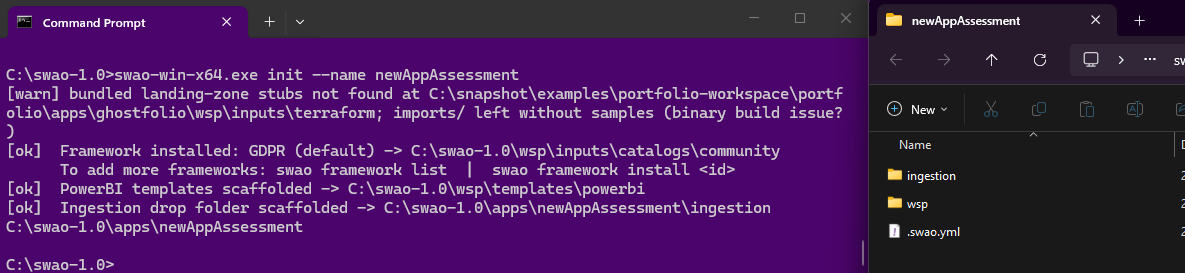
A swao init --name <app-id> run with the Windows Explorer split view alongside. The command installs the GDPR community framework into wsp/inputs/catalogs/community, scaffolds the Power BI .pbit templates into wsp/templates/powerbi, and creates the app ingestion folder under apps/<app-id>/ingestion. The right pane shows the resulting workspace: three items ready -- ingestion/, wsp/, and .swao.yml.
One command, portfolio-ready. No manual folder creation or template hunting.
swao health-check -- all 11 probes
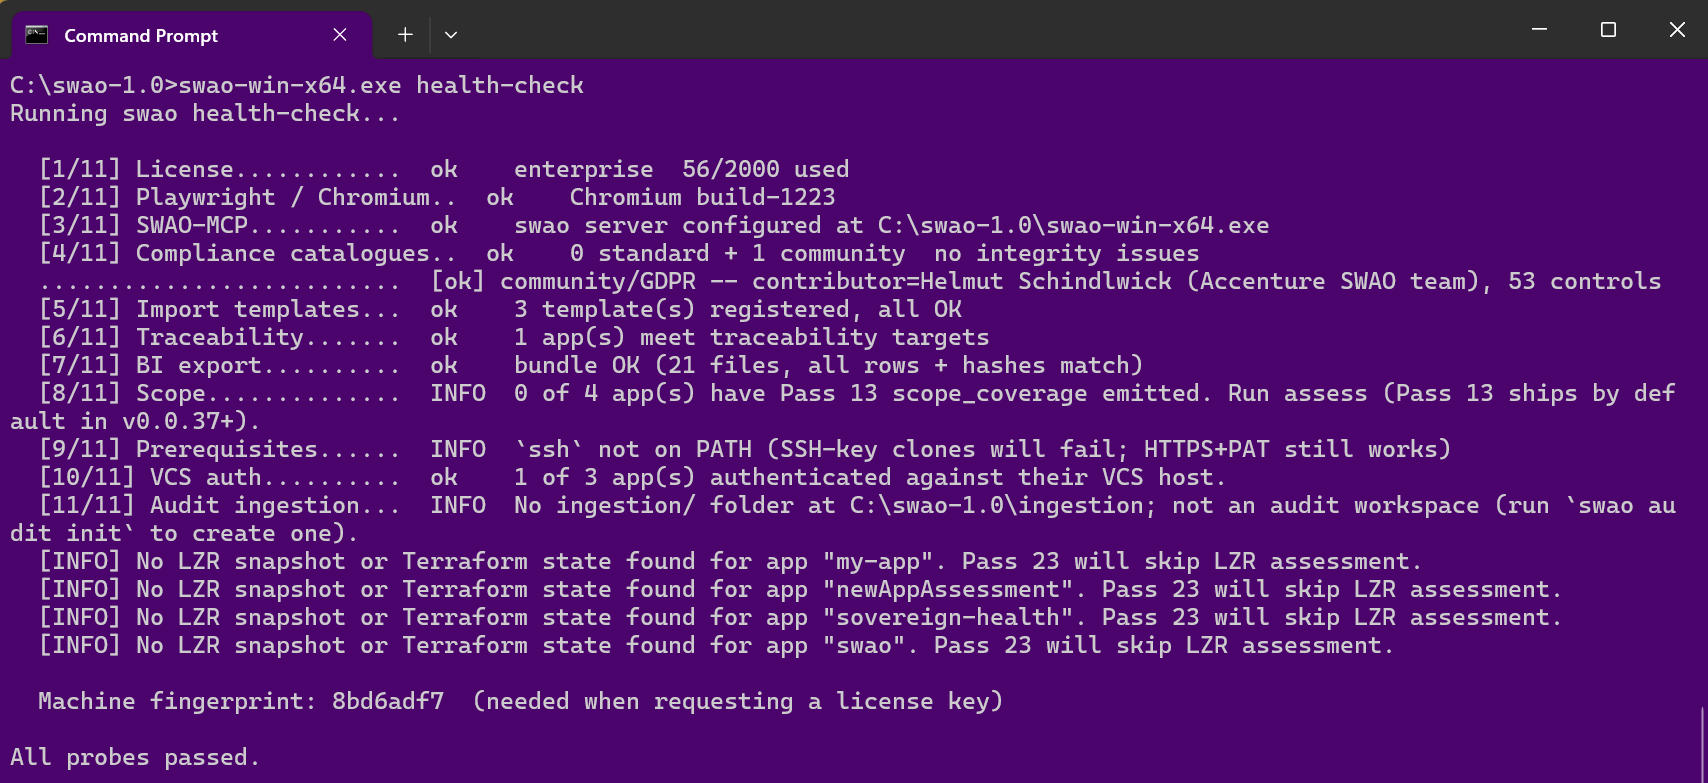
Output of swao health-check against a fully-configured Enterprise workspace. All 11 probes report their status:
| Probe | Result |
|---|---|
| License | ok -- Enterprise, 56/2000 used |
| Playwright / Chromium | ok -- Chromium build-1223 |
| SWAO-MCP | ok -- server configured |
| Compliance catalogues | ok -- GDPR community framework, 53 controls, no integrity issues |
| Import templates | ok -- 3 templates registered |
| Traceability | ok -- 1 app meets targets |
| BI export | ok -- 21 files, all rows and hashes match |
| Scope | INFO -- awaiting Pass 13 run |
| Prerequisites | INFO -- ssh not on PATH (HTTPS clone still works) |
| VCS auth | ok -- 1 of 3 apps authenticated |
| Audit ingestion | INFO -- no audit workspace configured |
Machine fingerprint shown at the bottom -- used when requesting a licence key.
swao assess -- multi-pass pipeline streaming
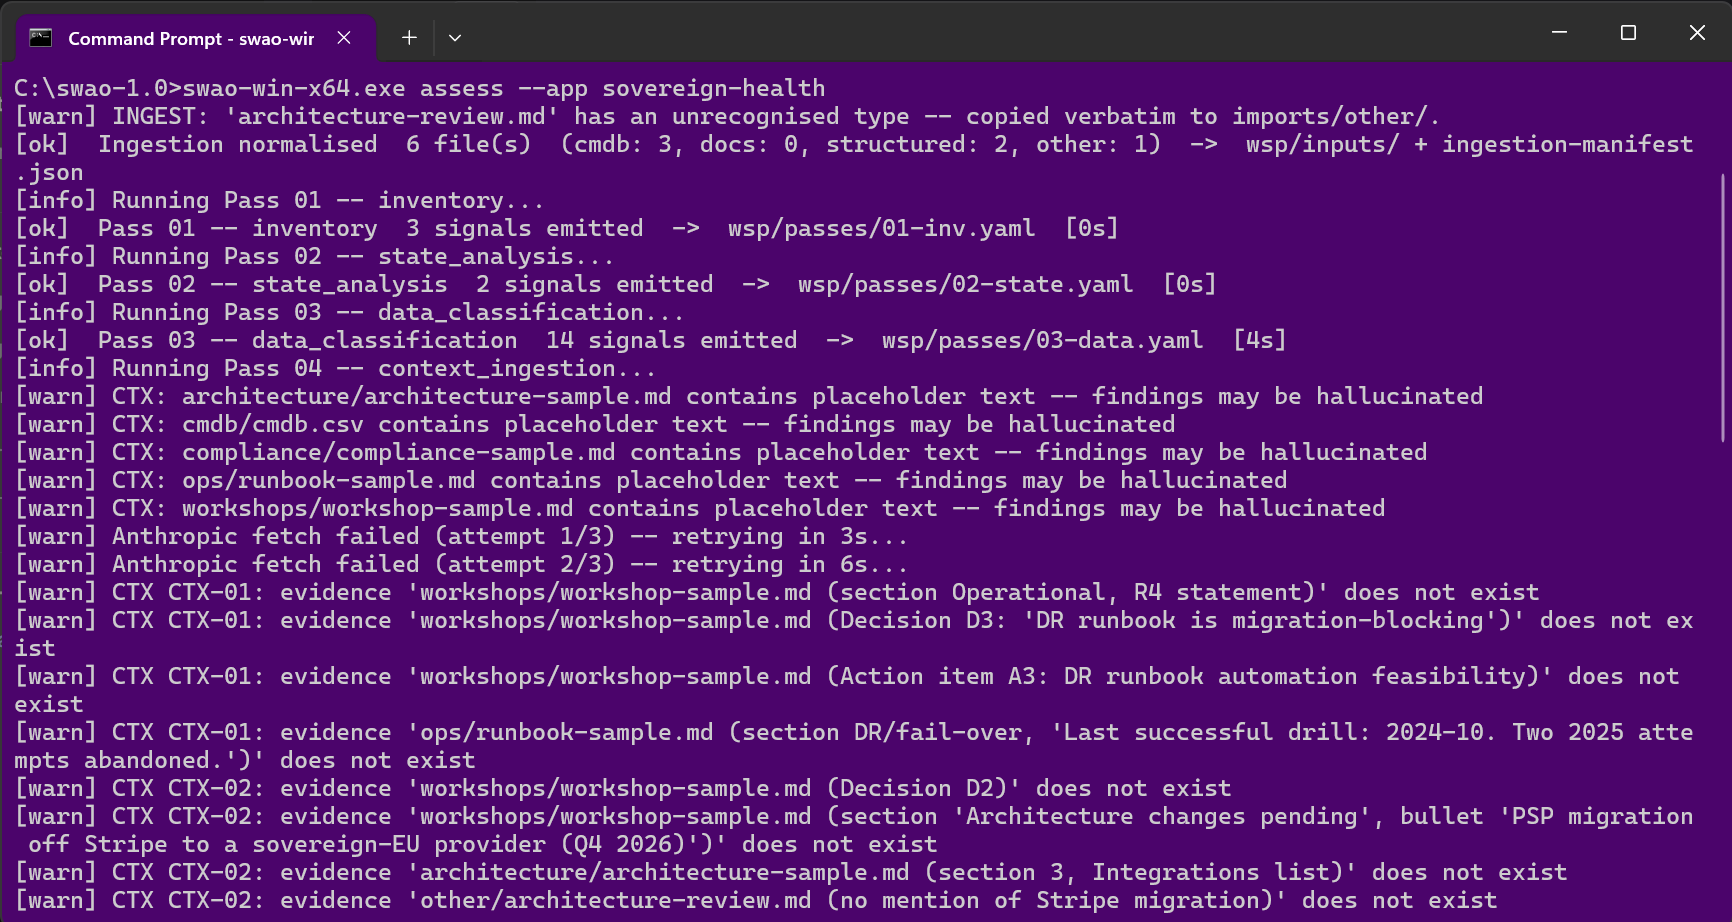
swao assess --app sovereign-health streaming in real time. Passes 01 (inventory), 02 (state analysis), 03 (data classification) and 04 (context ingestion) are visible, each emitting a signal count and wall-clock time on completion. The CTX warnings show the assessment engine probing for optional context files (architecture review, compliance policy, workshop notes) that are not present in this workspace -- the pass continues and the signals that can be derived from source code alone are still emitted.
The multi-pass pipeline is the heart of SWAO. Three passes invoke the LLM; everything else is deterministic static analysis.
Power BI reports
Application Dashboard -- overview page
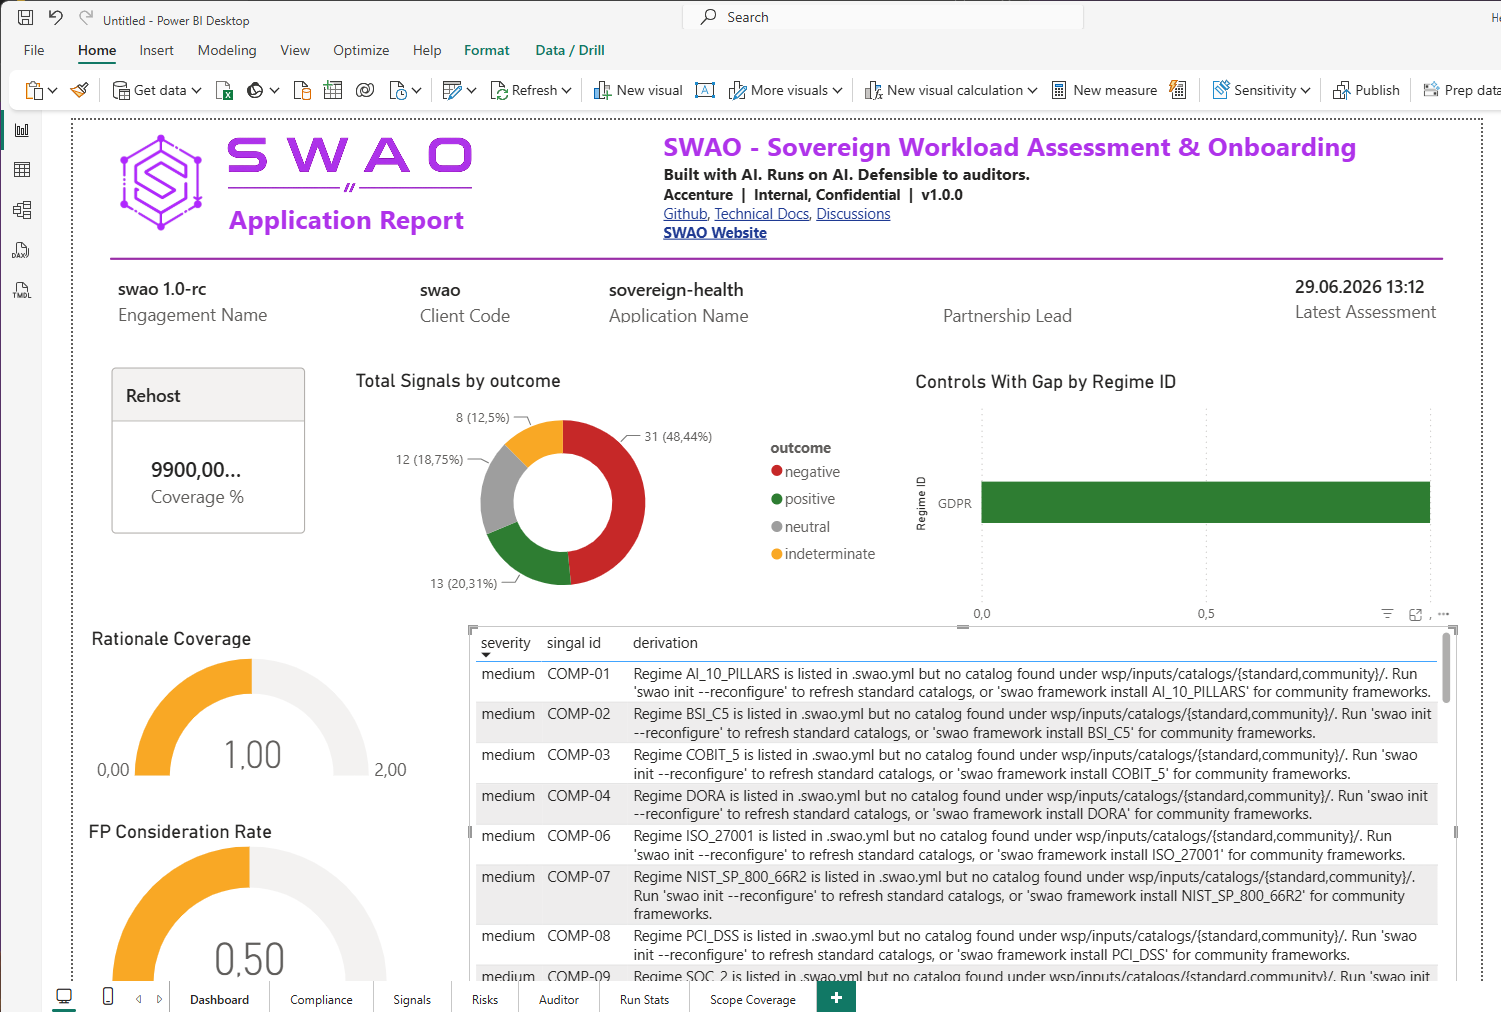
The single-app Power BI report opened against a real assessment bundle. The header row shows engagement metadata, the SWAO branding block, and the assessment timestamp. Below: a Total Signals by outcome donut chart, a Controls With Gap by Regime ID bar chart showing which compliance regimes have the most open gaps, and summary cards for Rationale Coverage and FP Consideration Rate. The lower table exposes the per-signal rationale text that drives every verdict -- this is what makes findings auditor-defensible.
First page a consultant opens with a customer. Signals, gaps, and rationale in one view.
Compliance matrix -- control-by-control status
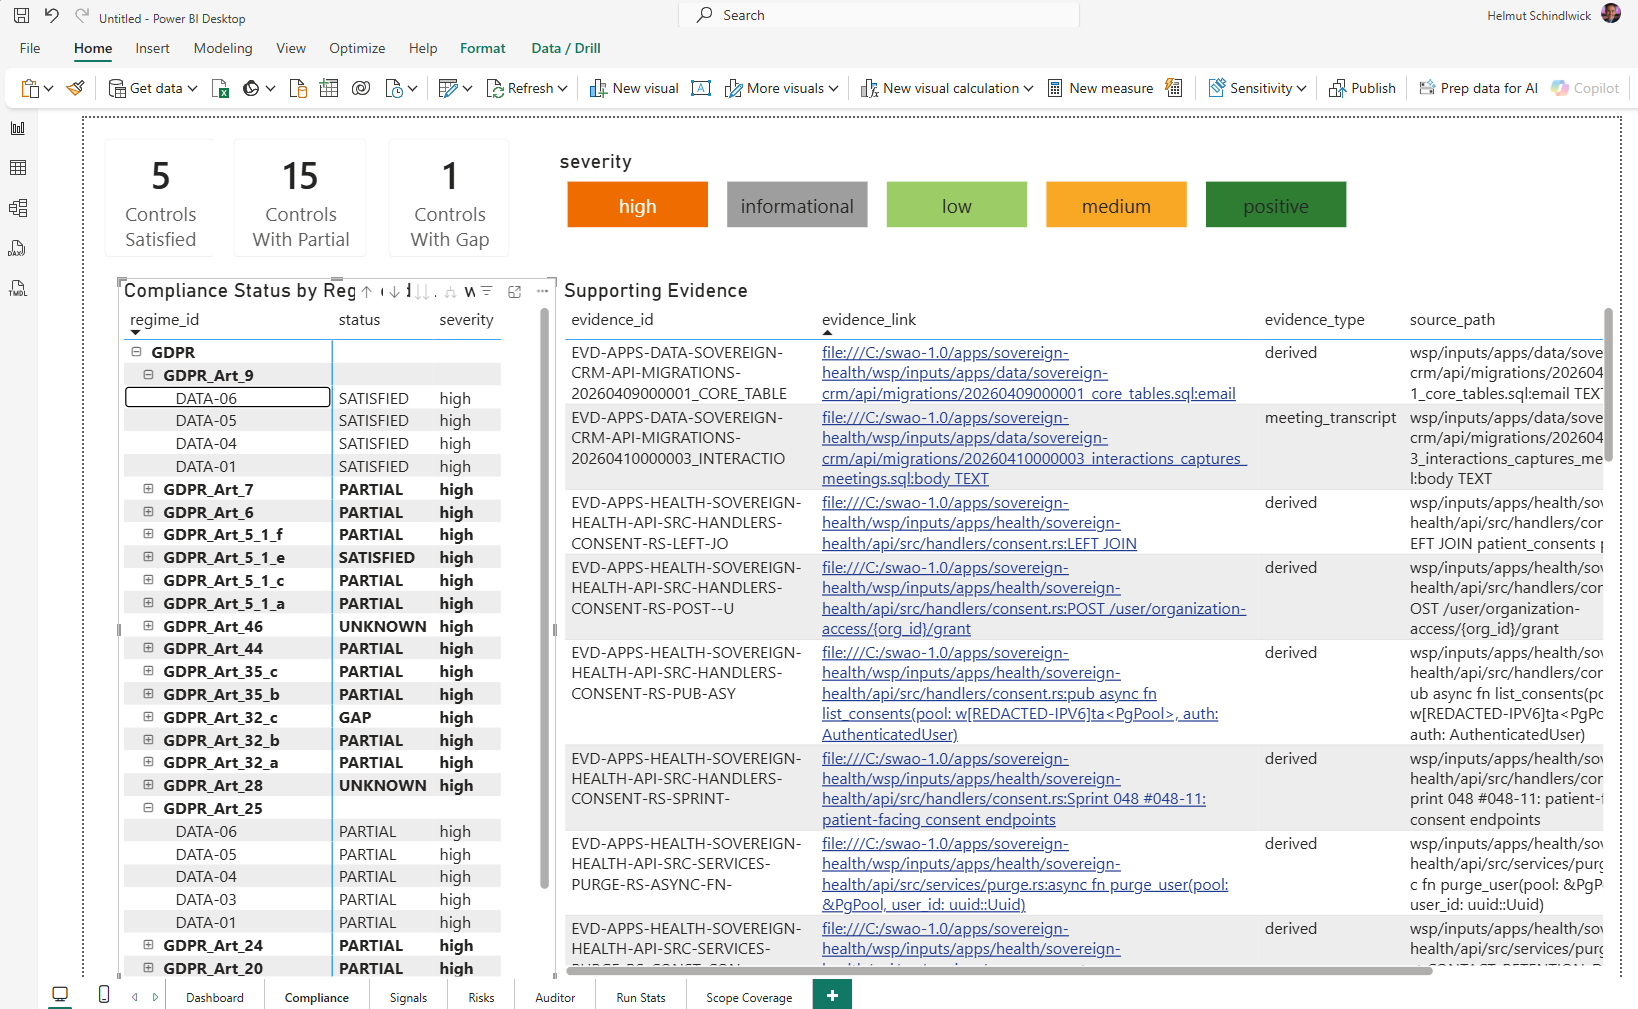
The Compliance page with the full GDPR control matrix. Top cards show: 5 controls Satisfied, 15 controls With Gap, 1 Informational. The main table lists every GDPR control by ID with its severity and verdict (SATISFIED / PARTIAL / UNKNOWN). The Supporting Evidence panel on the right links each verdict to the source signals and evidence URLs that produced it.
Auditor-grade traceability. Every cell drills down to the evidence that justified it.
Risks page -- risk register with scoring
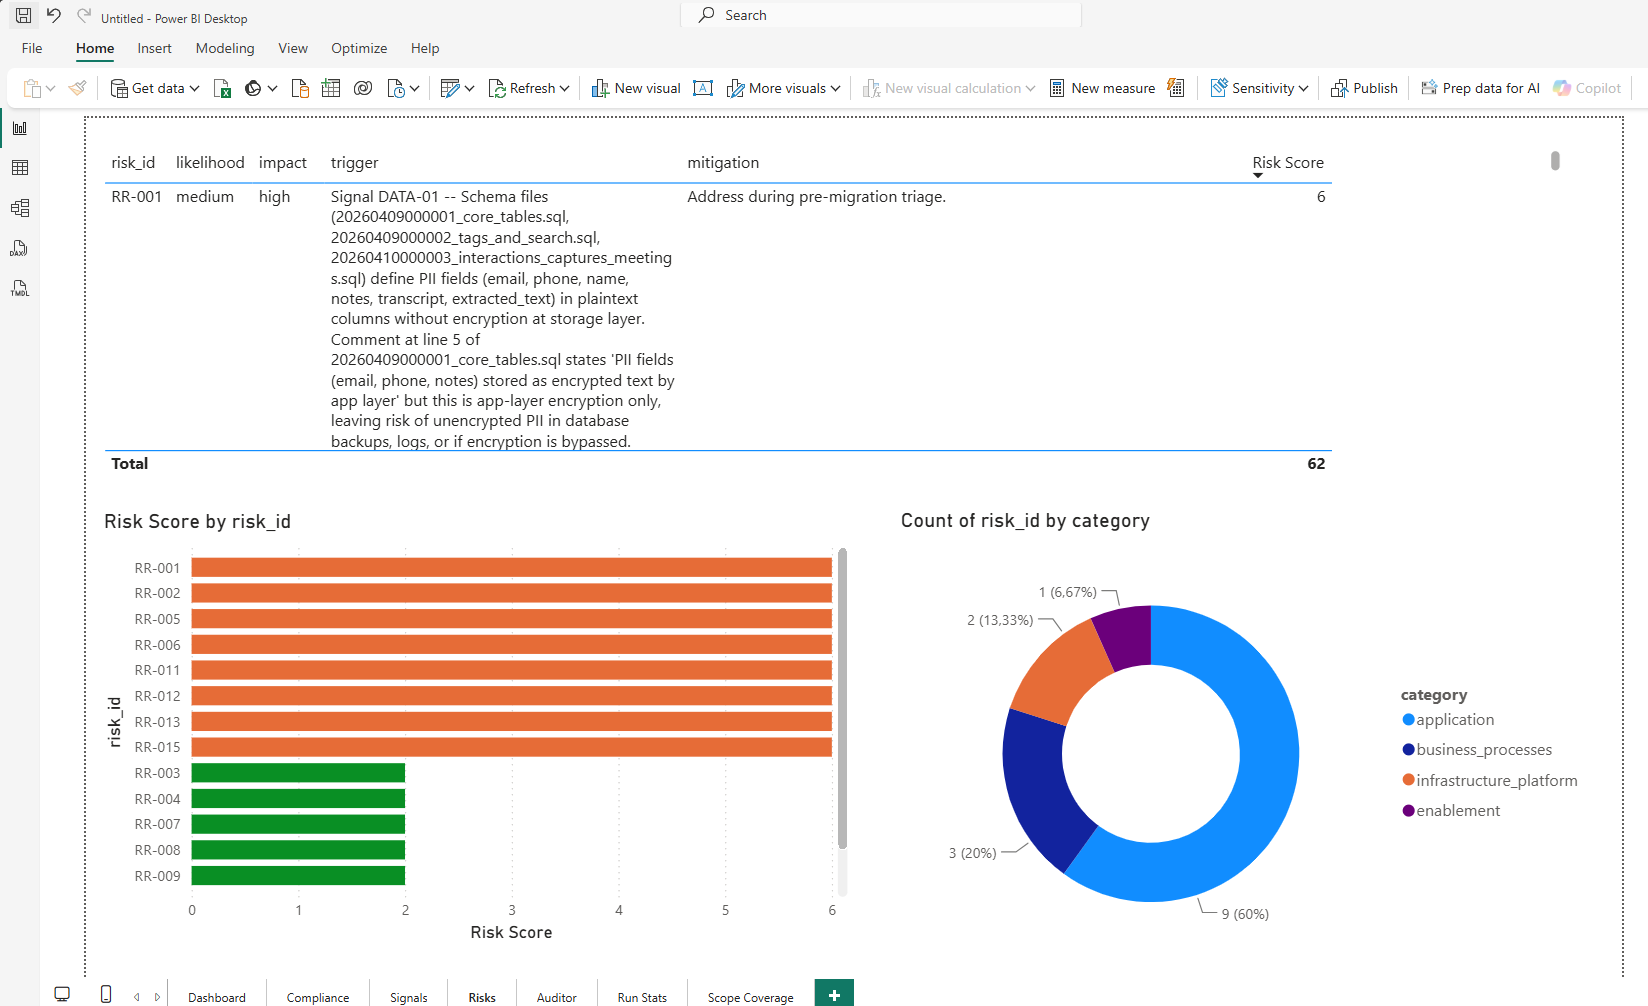
The Risks page with three panels. The risk register table at the top shows each risk entry with likelihood, impact, a full trigger description, and a mitigation action -- the top entry (RR-001, score 6) identifies PII fields stored without encryption at the database layer. The Risk Score by risk_id horizontal bar chart ranks all risks by score, colour-coded red/orange/green. The Count of risk_id by category donut breaks the register by domain: application (60%), business_processes (20%), infrastructure_platform (13%), enablement (7%).
Risk register that auditors recognise. Score, trigger, mitigation, and owner in one view.
Auditor page -- signal-level rationale
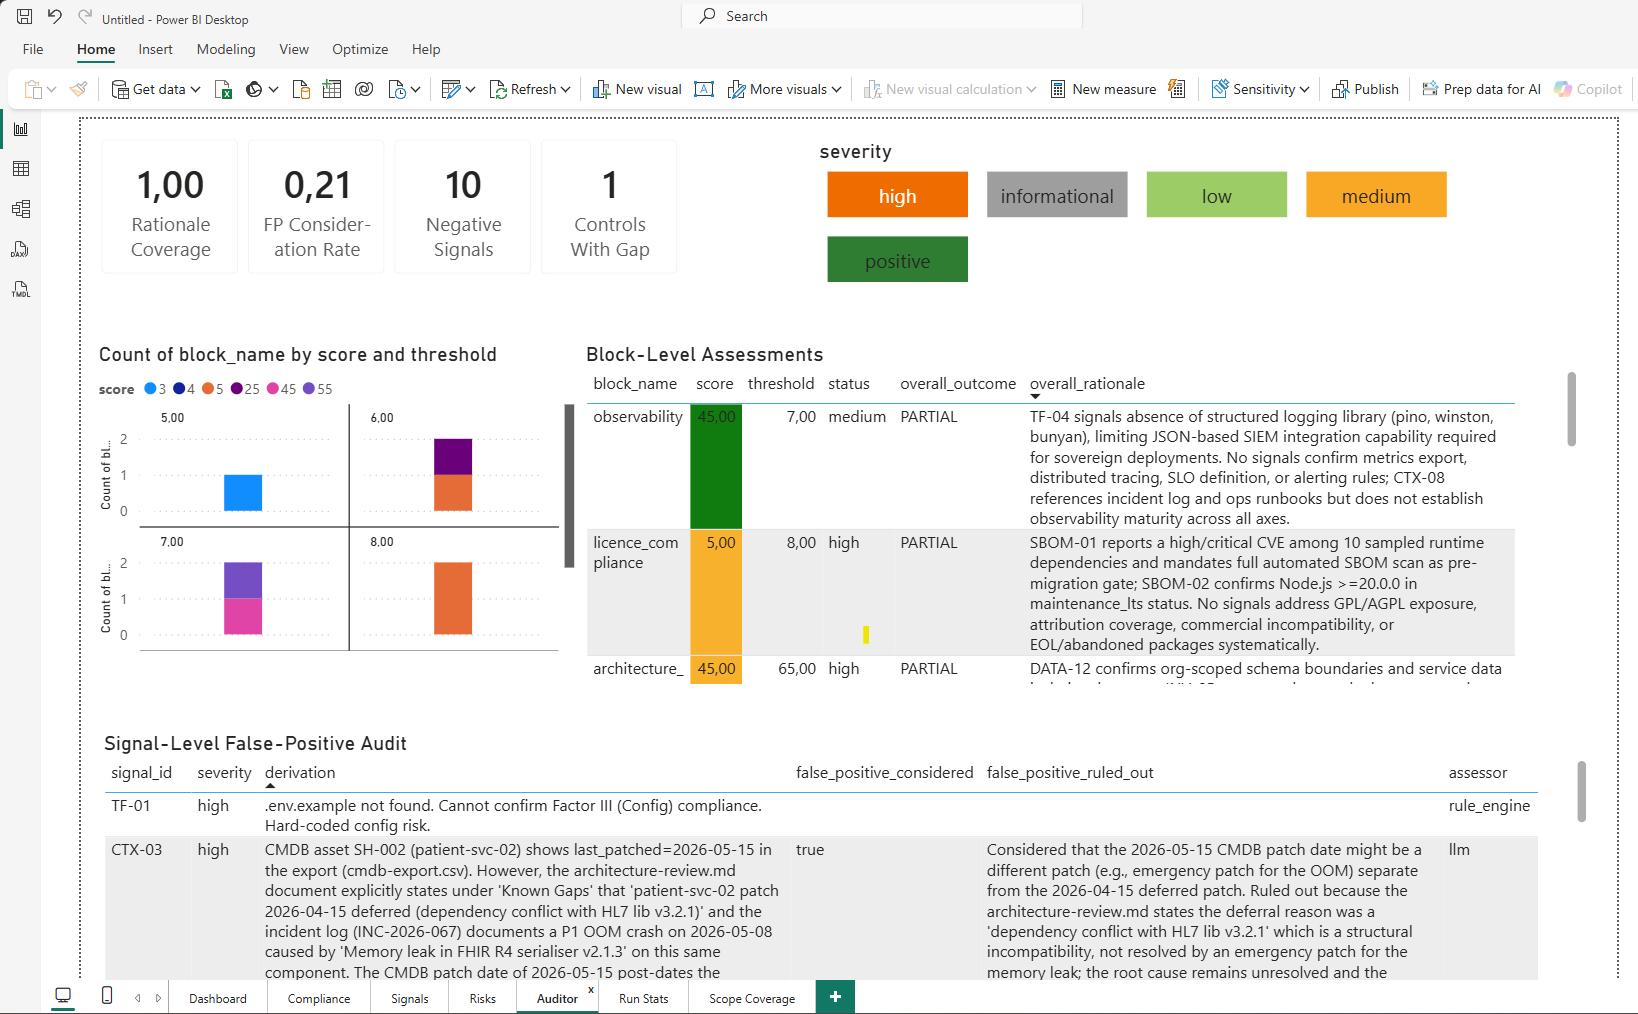
The Auditor page with four summary cards: Rationale Coverage 1.00, FP Consideration Rate 0.21, 10 Negative Signals, 1 Control With Gap. The Block-Level Assessments bar chart groups signals by code block and score. Below, the Signal-Level False-Positive table shows each signal with its false_positive_considered flag and the LLM-generated overall_rationale text. This is the page an external auditor opens to verify that every finding has a documented derivation.
Every verdict carries a traceable rationale -- rule_engine or llm, with reasoning shown.
Portfolio Overview -- multi-app dashboard
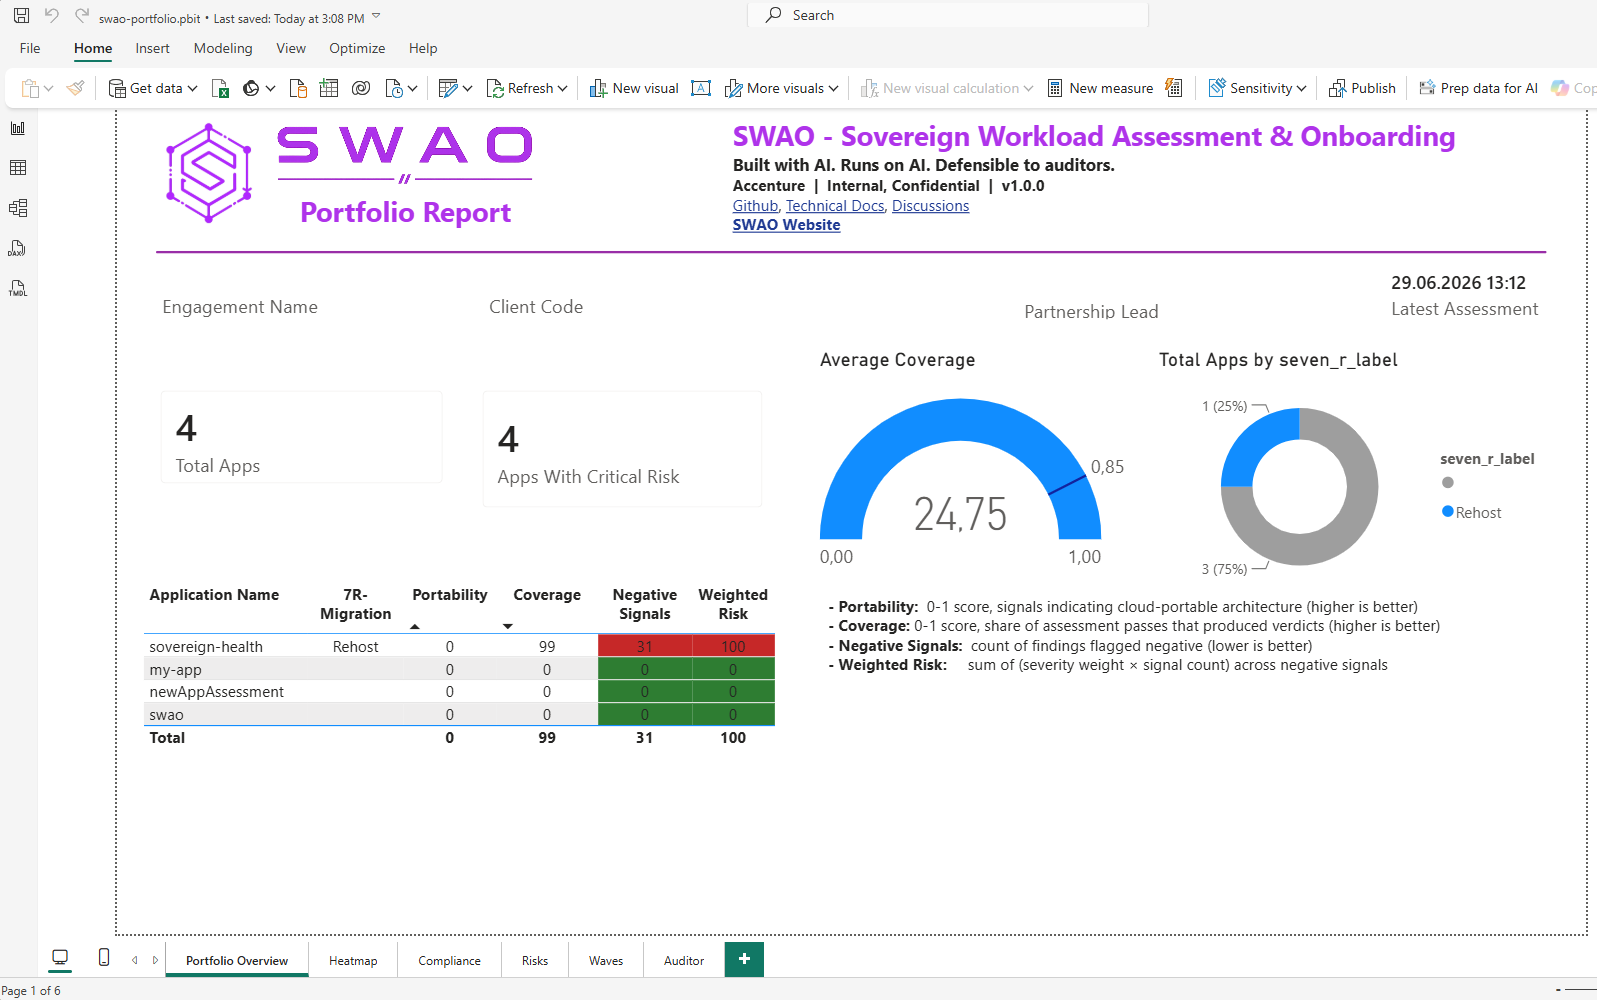
The portfolio Power BI report with four assessed applications. Top cards: 4 Total Apps, 4 Apps With Critical Risk, Average Coverage 24.75%. The Total Apps by 7R donut shows the migration strategy distribution across the portfolio. The portfolio table below ranks applications by portability, coverage, negative signals, and weighted risk -- making it straightforward to prioritise which app needs attention first.
When the portfolio scales to 20 or 50 apps, this page becomes the primary dashboard.
Portfolio Auditor Roll-up -- cross-app compliance view
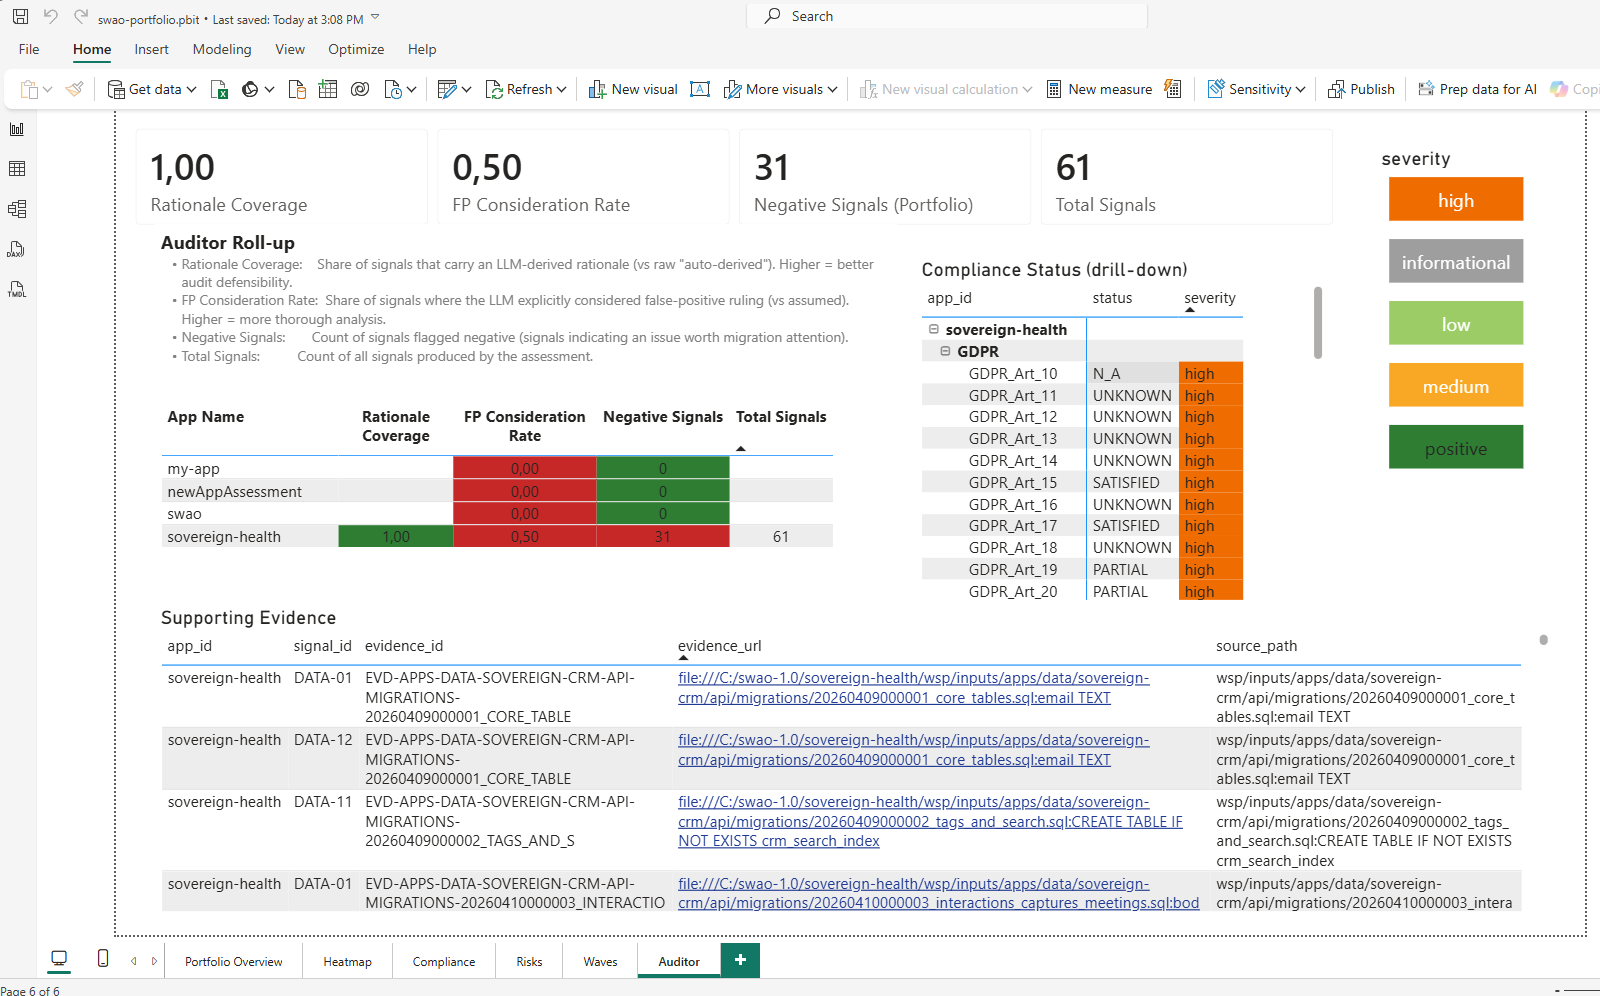
The Portfolio Auditor Roll-up page aggregates compliance status across all apps in the portfolio. Top cards show portfolio-level metrics: Average Coverage 1.00, FP Consideration Rate 0.50, 31 Negative Signals, 61 Total Signals. The Auditor Roll-Up table lists each app with its individual coverage and FP rate. The Compliance Status matrix shows every GDPR control (d-10 view) with its per-app verdict side by side. The Supporting Evidence table at the bottom links every verdict to source signals and evidence paths.
Portfolio governance in one page. Compliance officers can spot cross-app pattern gaps instantly.
Terminal interface (TUI)
Main Menu
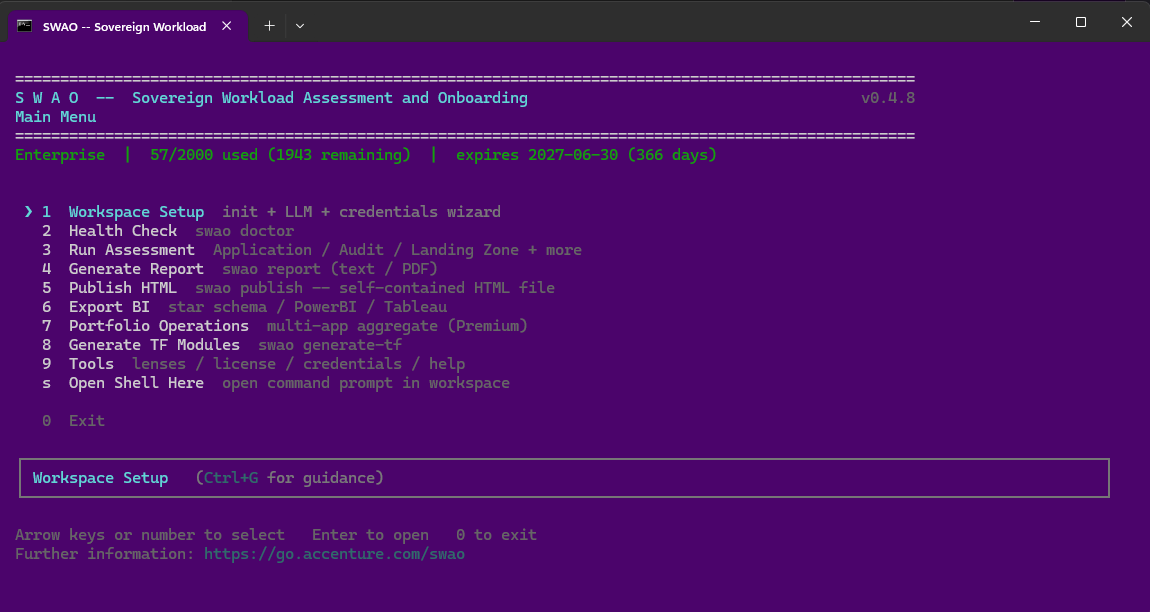
The SWAO terminal interface launched with no arguments -- swao from any directory. The Enterprise licence status bar shows 57/2000 used, expires 2027-06-30. All nine numbered options are visible alongside their descriptions:
| Key | Option | What it does |
|---|---|---|
| 1 | Workspace Setup | init + LLM + credentials wizard |
| 2 | Health Check | swao doctor |
| 3 | Run Assessment | Application / Audit / Landing Zone + more |
| 4 | Generate Report | swao report (text / PDF) |
| 5 | Publish HTML | swao publish -- self-contained HTML file |
| 6 | Export BI | star schema / PowerBI / Tableau |
| 7 | Portfolio Operations | multi-app aggregate (Enterprise) |
| 8 | Generate TF Modules | swao generate-tf |
| 9 | Tools | lenses / licence / credentials / help |
| s | Open Shell Here | open command prompt in workspace |
| 0 | Exit |
The guidance box at the bottom updates with a description of the highlighted item. Press Ctrl+G to collapse it.
Workspace Setup wizard
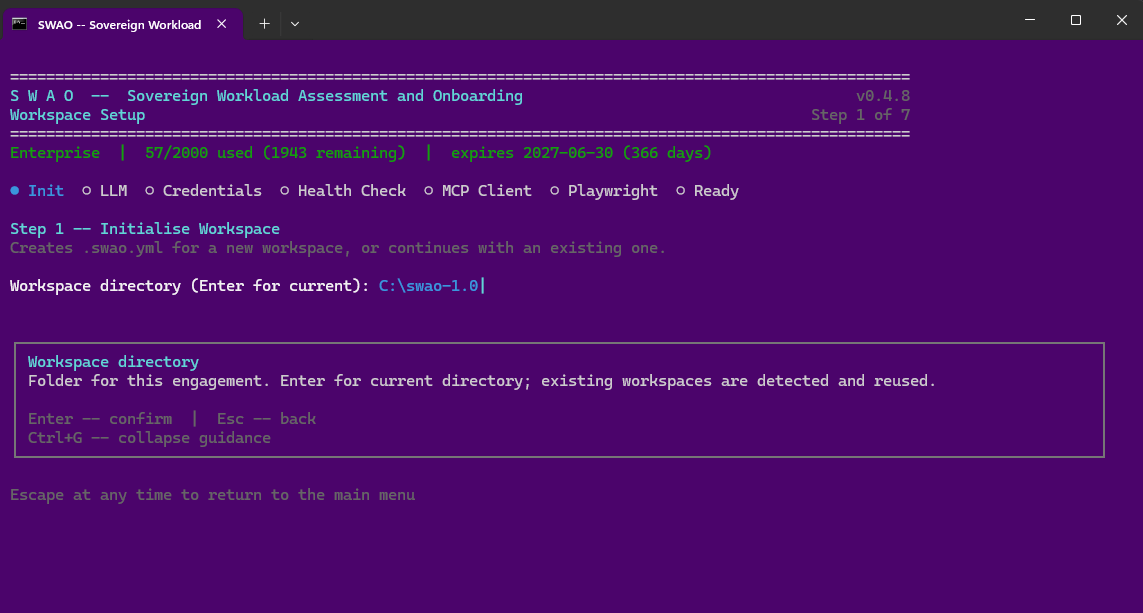
The Workspace Setup wizard (menu item 1) at Step 1 of 7. The progress dots at the top show the full journey: Init, LLM, Credentials, Health Check, MCP Client, Playwright, Ready. Step 1 asks for the workspace directory -- pressing Enter accepts the current directory; existing workspaces are detected and reused automatically. The guidance box (Ctrl+G to collapse) explains each field. Escape returns to the main menu at any point.
The wizard is the recommended first-time experience. It configures the workspace, LLM provider, credentials, and MCP connector in a single guided flow.
Health Check -- TUI view
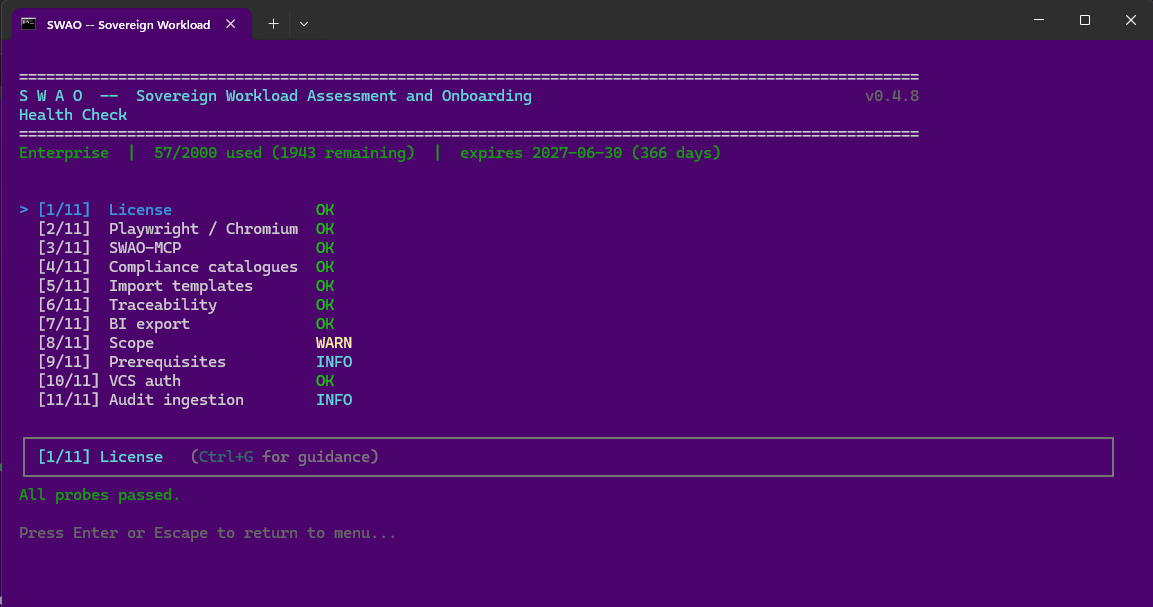
The Health Check screen (menu item 2) with all 11 probes listed. Seven probes show OK in green; Scope and Audit ingestion show INFO in cyan; Prerequisites shows INFO. The guidance box at the bottom describes the selected probe in detail -- press Ctrl+G to collapse it. "All probes passed." confirms the workspace is ready for assessment. Press Enter or Escape to return to the main menu.
Run Assessment -- type selection
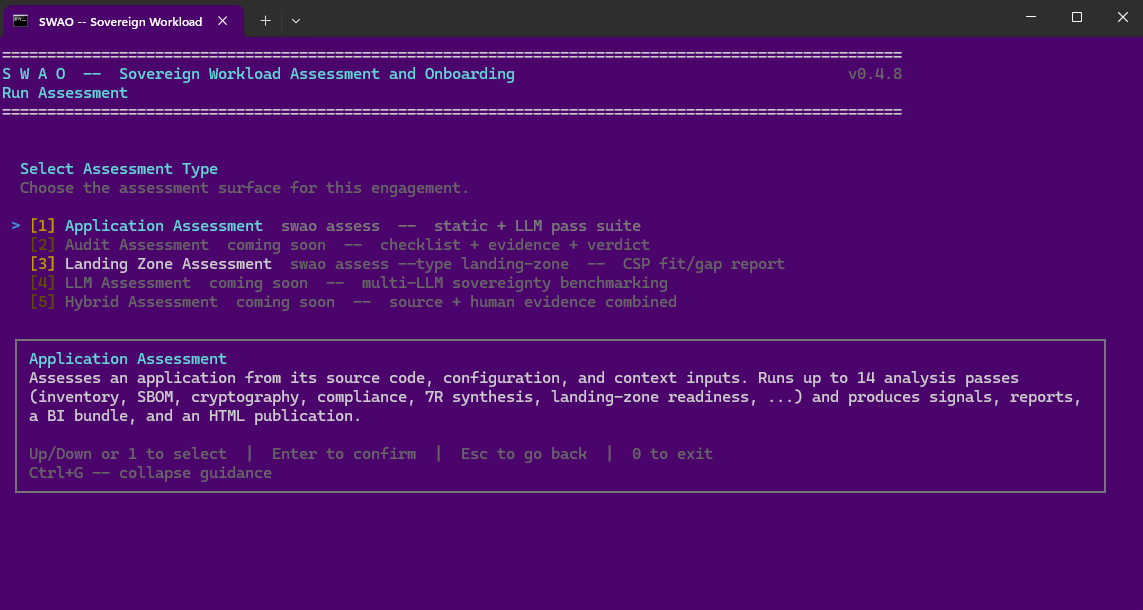
The Run Assessment screen (menu item 3) showing the five assessment surfaces. Two are active and immediately usable; three are coming soon:
| Key | Type | Status |
|---|---|---|
| [1] | Application Assessment | Active -- swao assess, static + LLM pass suite |
| [2] | Audit Assessment | Coming soon -- checklist + evidence + verdict |
| [3] | Landing Zone Assessment | Active -- swao assess --type landing-zone, CSP fit/gap report |
| [4] | LLM Assessment | Coming soon -- multi-LLM sovereignty benchmarking |
| [5] | Hybrid Assessment | Coming soon -- source + human evidence combined |
The guidance box describes the highlighted type in full. Application Assessment is the primary entry point: it runs up to 14 analysis passes across inventory, SBOM, cryptography, compliance, 7R synthesis, landing-zone readiness, and produces signals, reports, a BI bundle, and an HTML publication.
Publish HTML screen
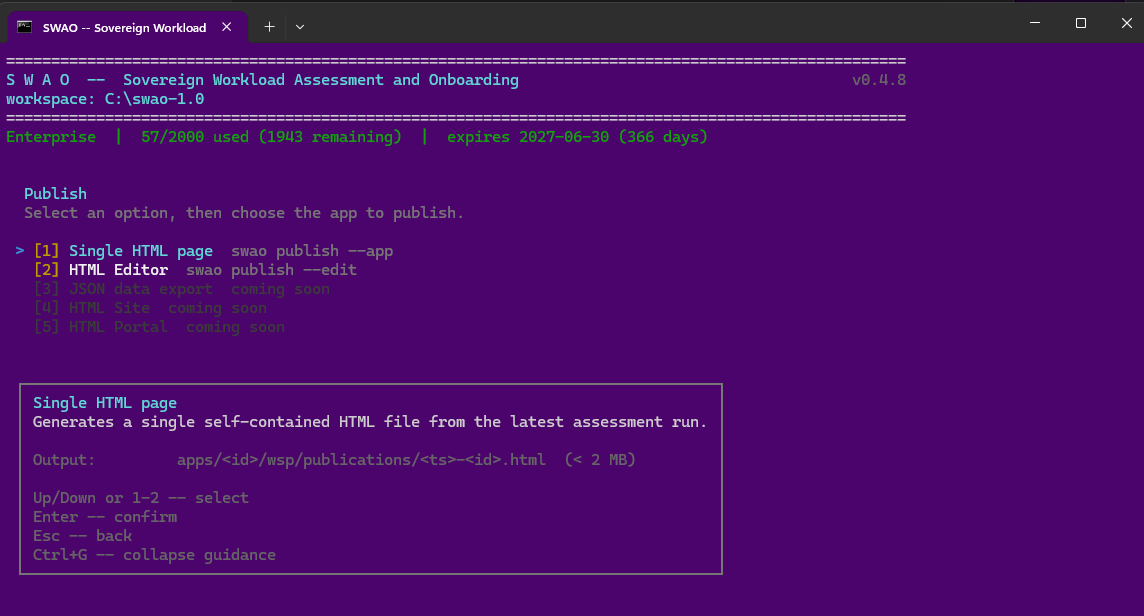
The Publish screen (menu item 5) with two active publication options and three coming-soon entries:
- [1] Single HTML page (
swao publish --app) -- generates a single self-contained HTML file from the latest assessment run, output toapps/<id>/wsp/publications/<ts>-<id>.html(under 2 MB, email-ready). - [2] HTML Editor (
swao publish --edit) -- opens the interactive in-browser editor to customise the publication before saving.
The guidance box describes the output path and format for the selected option.
MCP connector
SWAO connected in Claude Desktop
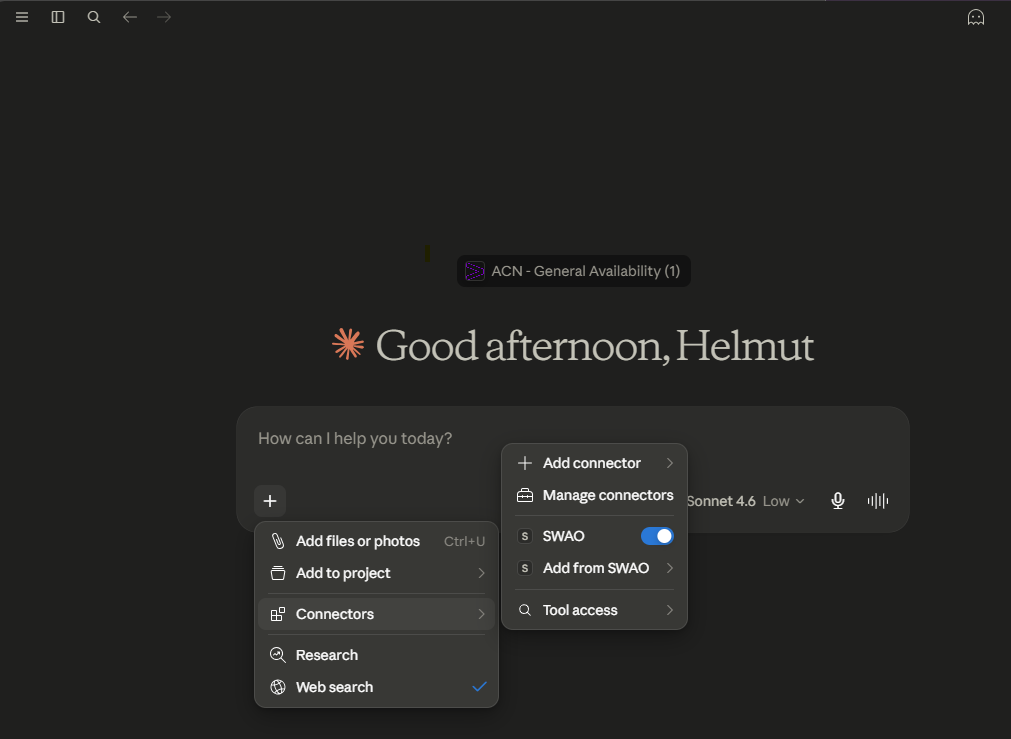
Claude Desktop with the Connectors panel open, showing the SWAO connector enabled (blue toggle). The menu shows "Add from SWAO" and "Tool access" entries alongside the standard connector management options. The SWAO connector is part of the ACN General Availability deployment -- no manual configuration required for operators on that tenant.
Once connected, Claude can call SWAO MCP tools directly from any conversation: read workspace signals, query compliance gaps, and return structured assessment findings grounded in the actual workspace data.
MCP: natural-language compliance challenge
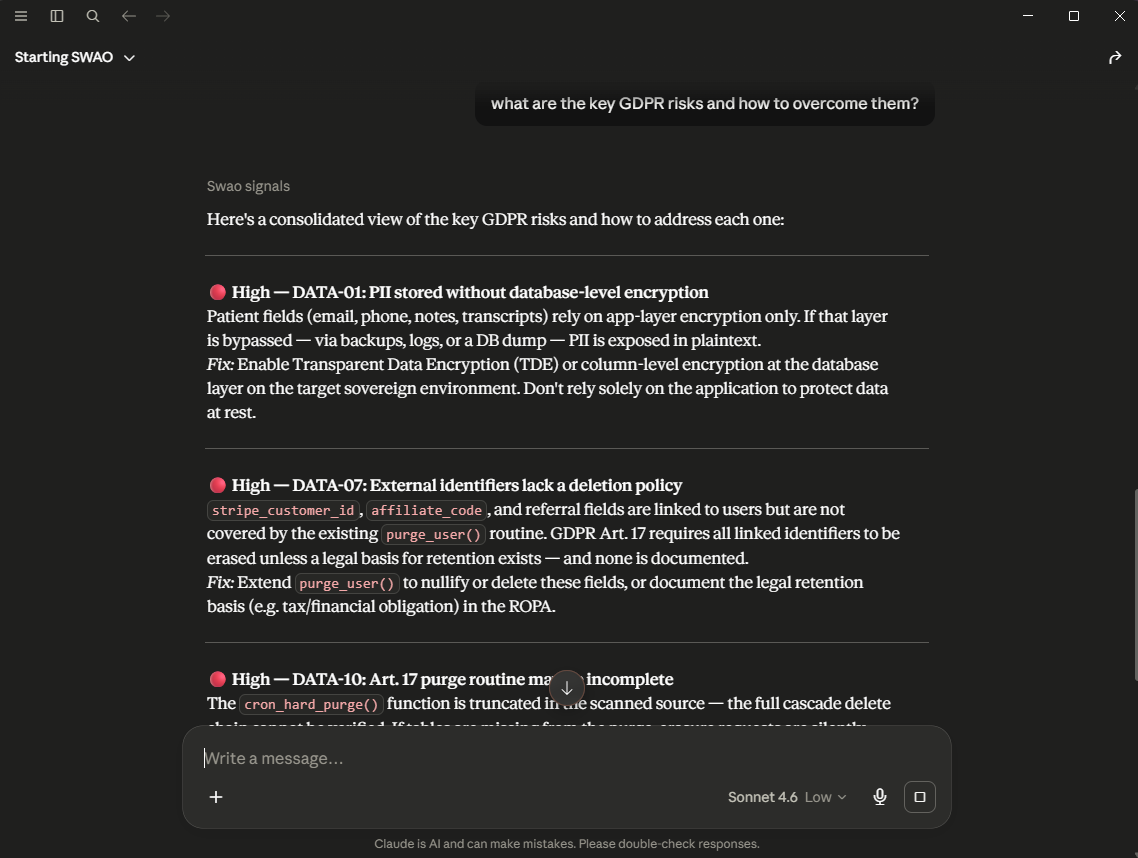
A Claude Desktop conversation in the Starting SWAO project. The operator asks: "what are the key GDPR risks and how to overcome them?" Claude invokes the Swao signals MCP tool and returns a structured, signal-grounded answer:
- High -- DATA-01: PII stored without database-level encryption. Patient fields (email, phone, notes, transcripts) rely on app-layer encryption only; a DB dump or backup exposes them in plaintext. Fix: enable TDE or column-level encryption on the sovereign target.
- High -- DATA-07: External identifiers (
stripe_customer_id,affiliate_code) lack a deletion policy and are not covered by the existingpurge_user()routine. Fix: extendpurge_user()or document the legal retention basis in the ROPA. - High -- DATA-10: Art. 17 purge routine incomplete -- the
cron_hard_purge()function is truncated in the scanned source.
Every finding is sourced directly from the workspace signal store -- no hallucination, no generic advice. The response uses the same signal IDs and rationale text that appear in the Power BI Auditor page and the HTML publication.
This is the "wow" moment. A natural-language question; a structured, auditor-grade answer grounded in the actual codebase.